
Activity diagrams are one of the most versatile tools in the Unified Modeling Language (UML) toolkit. They provide a dynamic view of a system, illustrating the flow of control from one activity to another. However, despite their widespread use in software engineering, business process modeling, and system architecture, there exists a significant amount of confusion surrounding their notation. Many practitioners mistake them for standard flowcharts or misuse the symbols defined in the standard.
This guide aims to clarify the misconceptions that often plague the creation and interpretation of activity diagrams. By separating fact from fiction, we can ensure that our models accurately reflect the intended logic without ambiguity. We will explore the specific symbols, the rules governing their usage, and the common pitfalls that lead to miscommunication among stakeholders.
Understanding the Core Purpose 🛠️
Before diving into the myths, it is essential to establish what an activity diagram actually represents. At its core, it models the behavior of a system. It is not merely a drawing of steps; it is a specification of control flow and object flow.
- Control Flow: Indicates the sequence in which activities are performed. It governs the logic of the system.
- Object Flow: Shows the movement of data or objects between activities. It highlights the inputs and outputs required for each step.
When these two concepts are conflated, the resulting diagram becomes cluttered and difficult to maintain. The notation is designed to be precise, allowing for complex logic like concurrency, branching, and looping to be visualized clearly.
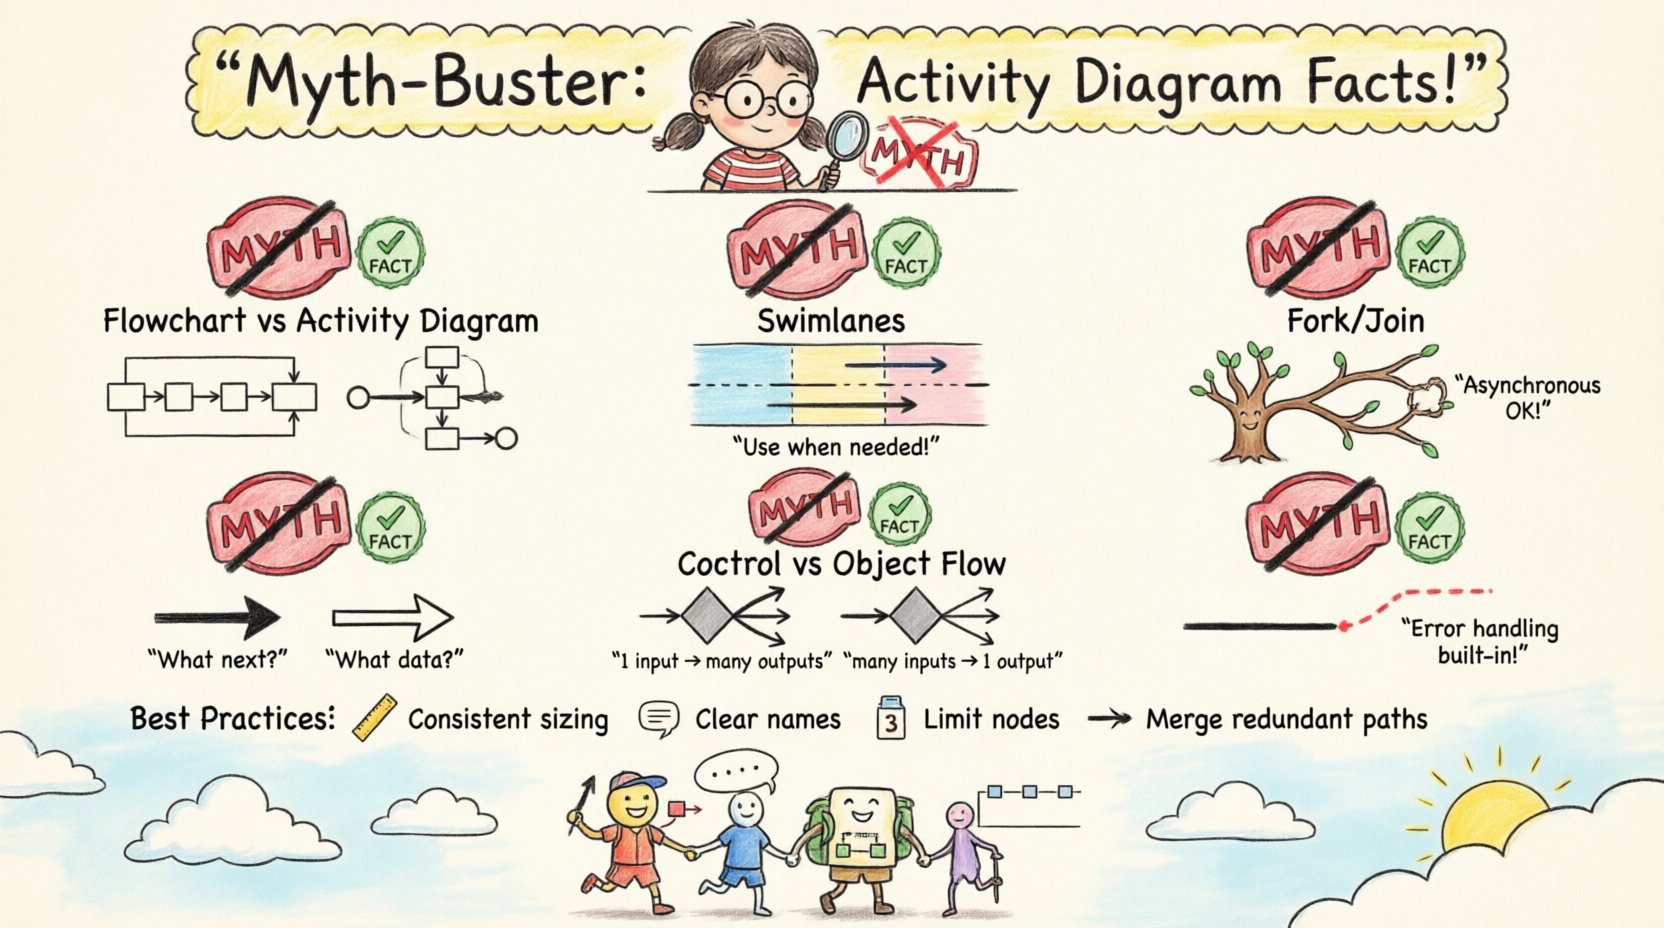
Myth 1: Activity Diagrams Are Just Flowcharts 📊
One of the most persistent myths is that activity diagrams are simply flowcharts with different names. While they share a common ancestry, the standards governing them differ significantly.
The Differences
- Concurrency: Standard flowcharts struggle to represent parallel processes effectively. Activity diagrams use Fork and Join nodes to explicitly define where a single thread of control splits into multiple concurrent threads and where they converge.
- Object Flow: Flowcharts typically focus on control. Activity diagrams explicitly model the data objects that flow between activities using object nodes and object flows.
- Granularity: Activity diagrams allow for nested structures through Activity Partitions (Swimlanes), which can represent organizational boundaries or system components. Flowcharts generally lack this hierarchical capability without becoming unreadable.
Why It Matters
Using a flowchart mindset for activity diagrams often leads to oversimplified models that fail to capture the complexity of concurrent system behavior. In a distributed system, for instance, knowing that two processes run simultaneously is critical. A flowchart might imply sequential execution unless explicitly annotated, whereas an activity diagram makes this a structural requirement.
Myth 2: Swimlanes Are Mandatory for All Diagrams ⚙️
It is often believed that every activity diagram must be divided into swimlanes to be valid. While swimlanes (activity partitions) are powerful, they are not a requirement for every scenario.
When to Use Swimlanes
- Organizational Responsibility: If the diagram needs to show which role or department is responsible for a specific task.
- System Components: If the workflow spans multiple software modules or hardware units.
- Complexity Reduction: When a single thread of control is too complex to follow, partitioning the diagram by actor can improve readability.
When to Avoid Them
- Simple Algorithms: For a single method or a straightforward algorithm, swimlanes add unnecessary visual noise.
- Abstract Logic: If the logic is independent of the actor performing it, partitions do not add value.
Forcing swimlanes onto a simple process can fragment the flow, making it harder to see the overall path from start to finish. The notation should serve the understanding, not complicate it.
Myth 3: Fork and Join Must Be Symmetric 🔄
A common misunderstanding regarding concurrency is the belief that every Fork node must be paired with a corresponding Join node in a symmetric manner. While this is the standard pattern for synchronization, it is not an absolute rule.
Asynchronous Behavior
In many real-world systems, threads do not need to synchronize at every point. A fork can create multiple threads of control that operate independently. Some may complete quickly, while others may wait for external events. Forcing a join node where none is logically required implies a synchronization point that does not exist in the system.
- Synchronization Join: All incoming flows must arrive before the outgoing flow can proceed. This is the standard join.
- Or Join: The outgoing flow proceeds as soon as any of the incoming flows arrive. This is valid in specific scenarios where the first event to complete triggers the next step.
Assuming symmetry restricts the modeler’s ability to describe asynchronous or event-driven behaviors accurately.
Myth 4: Object Flow and Control Flow Are Interchangeable 🧩
Confusion often arises between the lines that carry control and the lines that carry data. In the notation, these are visually distinct, but their semantic meanings are often blurred.
Control Flow Lines
These lines connect actions to define the order of execution. They do not carry data. They answer the question: “What happens next?”
Object Flow Lines
These lines connect actions to object nodes. They represent the consumption or production of data. They answer the question: “What data is being used or created?”
Comparison Table
| Feature | Control Flow | Object Flow |
|---|---|---|
| Symbol | Arrowhead | Arrowhead with Open arrow (or solid, depending on standard version) |
| Connects | Action to Action | Action to Object Node |
| Purpose | Sequence of Execution | Movement of Data |
| Guard Condition | Common on outgoing edges | Typically not used |
Using control flow to represent data movement can lead to logical errors in implementation. Developers might write code that passes data without checking if the action has actually produced it, or they might miss dependencies that are crucial for the system state.
Myth 5: Decision Nodes Are the Same as Merge Nodes ❌
Visually, a diamond shape is used for both decision and merge nodes. This similarity leads to the misconception that they are functionally identical, just reversed.
Decision Nodes
A Decision Node has one input and multiple outputs. It selects exactly one outgoing path based on a guard condition. It represents a branching point in logic.
Merge Nodes
A Merge Node has multiple inputs and one output. It combines alternative flows back into a single path. It does not make a choice; it simply acknowledges that the control can arrive from any of the preceding paths.
The Risk of Confusion
If a merge node is mistaken for a decision node, the modeler might accidentally introduce logic that implies a choice is being made at that point, even though none exists. Conversely, using a decision node where a merge is needed implies that the system must evaluate a condition to continue, which may not be true. The distinction is critical for ensuring the control flow is accurate.
Myth 6: Exceptions Are Not Part of Activity Diagrams 🚨
Many practitioners believe that exception handling must be represented using separate diagrams or text descriptions. The notation supports exception handling directly within the activity flow.
Exception Flows
An Exception Flow is an object flow that terminates when an exception occurs. It is typically drawn as a dashed line originating from an action.
- Explicit Handling: You can define a specific flow for an error condition (e.g., “Invalid Input”) that branches off from the main action.
- Implicit Handling: If no exception flow is defined, the system may halt or throw an error depending on the execution environment.
Integrating exceptions into the diagram provides a complete view of the system’s resilience. It shows stakeholders exactly how the system behaves when things go wrong, rather than only showing the happy path.
Best Practices for Notation Clarity ✅
To maintain the integrity of the model, adhering to specific best practices is essential. These guidelines help prevent the myths discussed above from taking root.
1. Maintain Consistent Granularity
Do not mix high-level business processes with low-level implementation details in the same diagram. If a single activity requires more than a few steps to explain, it should be decomposed into a nested activity diagram. This keeps the primary diagram readable.
2. Use Clear Naming Conventions
- Actions: Verb-Object format (e.g., “Calculate Total”, “Validate User”).
- Objects: Noun format (e.g., “Invoice”, “User Session”).
- Guard Conditions: Boolean expressions (e.g., “[Balance > 0]”).
3. Limit the Number of Nodes
A single diagram should ideally fit on one screen without excessive scrolling. If a diagram grows too large, it becomes a wall of text. Split complex workflows into logical groups using activity partitions or separate diagrams linked by context.
4. Avoid Redundant Paths
If two paths lead to the same outcome with no difference in state, merge them earlier in the flow. Redundancy creates maintenance overhead. If the logic changes in one path, you must update it in all identical paths.
Integration with Other Diagrams 📐
An activity diagram does not exist in isolation. It interacts with other UML diagrams to provide a complete system specification.
Use Case Diagrams
Activity diagrams often implement the logic described in a Use Case. While the Use Case diagram defines what the system does from a user perspective, the Activity diagram defines how it does it internally.
Class Diagrams
The object nodes in an activity diagram correspond to classes in the Class Diagram. This linkage ensures that the data structures used in the workflow match the persistent data model. For example, an “Invoice” object node should map to an “Invoice” class.
Sequence Diagrams
Sequence diagrams focus on the interaction between objects over time. Activity diagrams focus on the flow of control. Often, a complex activity within an activity diagram can be detailed using a sequence diagram to show the message exchange between specific components.
Common Notation Errors to Avoid ⚠️
Even experienced modelers make mistakes. Being aware of common errors helps in reviewing and validating diagrams.
- Dangling Edges: Ensure every arrowhead points to a valid node. Orphaned edges indicate incomplete logic.
- Disconnected Nodes: Every action should be reachable from the Initial Node and able to reach a Final Node.
- Missing Guard Conditions: Decision nodes without guard conditions are ambiguous. It is unclear which path is taken.
- Infinite Loops: Ensure that loops have a clear exit condition. Without this, the diagram represents a system that hangs indefinitely.
The Evolution of Notation 📜
It is worth noting that UML has evolved. UML 1.x and UML 2.x have slight differences in notation. For instance, the representation of the initial node changed from a filled circle in UML 1 to a black circle in UML 2. Similarly, the final node changed from an open circle to a black circle with an inner ring. When working with legacy systems, it is important to know which version of the standard is being referenced. Most modern tools default to UML 2.x, which offers more robust support for concurrency and exception handling.
Final Thoughts on Precision 🎯
The goal of activity diagram notation is precision. By adhering to the standard symbols and understanding the semantic differences between them, we create models that are not just pretty pictures but functional specifications. Debunking the myths allows us to focus on what truly matters: communicating system behavior clearly.
Whether you are designing a new microservice or mapping a business process, the rules of the notation provide the structure needed for success. Avoid the shortcuts that lead to ambiguity. Stick to the facts, use the symbols correctly, and ensure your diagrams tell the complete story of the system.
Remember, a diagram is a contract between the analyst and the developer. If the notation is flawed, the contract is broken. Take the time to understand the underlying logic of each node. Verify the control flow. Check the object flow. Ensure that the swimlanes reflect the actual architecture. With discipline and attention to detail, activity diagrams remain one of the most effective tools for system design.