
Software engineering continues to evolve at a breakneck pace, driven by cloud-native architectures, automated pipelines, and intelligent systems. Amidst this rapid transformation, visual modeling notations face a critical question: do they remain relevant, or do they become artifacts of the past? The activity diagram, a staple of the Unified Modeling Language (UML), stands at a pivotal moment. It is not merely a static drawing for documentation; it is evolving into a dynamic component of the development lifecycle.
This guide explores the trajectory of activity diagrams. We examine how they integrate with modern DevOps practices, support complex microservices architectures, and leverage emerging technologies like artificial intelligence. The goal is to understand the practical utility of this notation without succumbing to hype.
The Historical Context and Current State 📊
Activity diagrams describe the flow of control and data through a system. Historically, they served as blueprints during the design phase, mapping out processes before code was written. In waterfall methodologies, these diagrams were often treated as contracts between stakeholders and developers. If the diagram changed, the project scope technically changed. This rigidity caused friction as requirements shifted.
Today, the landscape has shifted towards iterative delivery. Developers write code, test it, and deploy it in short cycles. Static diagrams often become outdated immediately after creation. This lifecycle mismatch created a perception that activity diagrams were obsolete. However, the underlying need to visualize complex logic remains. The notation itself has not failed; the application method has required adaptation.
- Traditional Use: Documentation for requirements, handover between phases.
- Modern Challenge: Maintaining accuracy in fast-paced environments.
- Current Status: Transitioning from design artifacts to runtime aids.
The notation handles concurrency well, which is vital for modern systems. Standard UML activity diagrams support forks, joins, and object flows. These concepts map directly to multi-threaded execution, asynchronous messaging, and data pipelines. The challenge lies in keeping the visual representation synchronized with the actual running system.
Integration with DevOps and CI/CD Pipelines 🔄
DevOps emphasizes the automation of the software delivery process. Activity diagrams find a natural home here when visualizing the pipeline itself. Instead of documenting business logic alone, teams now use these diagrams to map deployment workflows, build stages, and testing gates.
When a pipeline is visualized, bottlenecks become visible. A simple fork-and-join structure can represent parallel testing environments. A decision node can represent a quality gate that requires manual approval before production. This visual abstraction helps non-technical stakeholders understand the journey from commit to deployment without reading configuration files.
Key areas where this integration occurs include:
- Build Visualization: Showing dependencies between compilation tasks.
- Deployment Flows: Mapping the sequence of environment promotion (Staging to Production).
- Failure Handling: Visualizing rollback triggers and error recovery paths.
- Monitoring Triggers: Linking alert conditions to specific workflow steps.
By treating the activity diagram as a living component of the infrastructure, teams ensure that the documentation reflects the reality of the system. This requires a shift in mindset where the diagram is updated alongside the pipeline configuration, not separately.
Navigating Microservices and Distributed Systems 🌐
Monolithic architectures are giving way to distributed systems. In a microservices environment, a single user request may traverse dozens of services. Tracing this flow is difficult with code alone. Activity diagrams provide a high-level view of these interactions without getting lost in implementation details.
Consider a service mesh. Traffic is routed dynamically. An activity diagram can model the decision logic for routing, load balancing, and circuit breaking. This helps architects understand the data flow across the network. It highlights potential points of failure where one service dependency impacts the entire chain.
However, complexity grows exponentially with scale. A single diagram cannot capture the entire ecosystem. The modern approach involves hierarchical modeling:
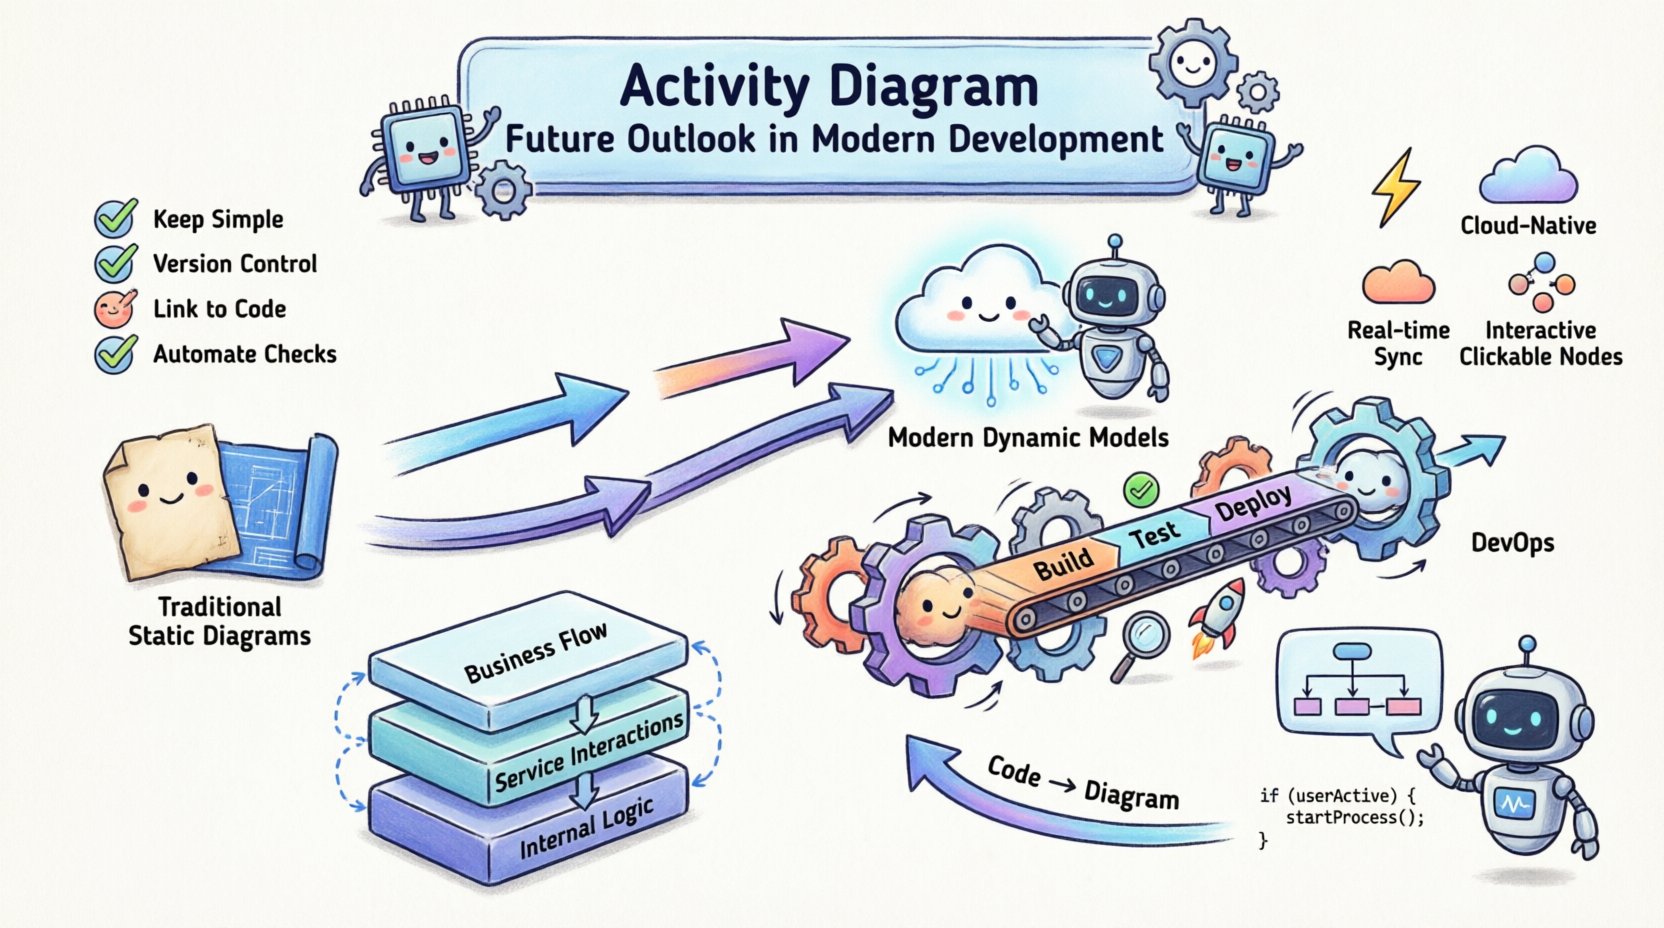
- Level 1: End-to-end business process flow.
- Level 2: Domain-specific service interactions.
- Level 3: Detailed logic within a specific service.
This layered approach prevents diagram clutter. It allows developers to drill down into specific areas only when necessary. It maintains the utility of the notation by keeping the scope manageable.
Model-Driven Architecture and Automation 🤖
Model-Driven Architecture (MDA) proposes that the model is the source of truth. While full automation remains elusive, the trend is moving towards code generation from models. Activity diagrams are particularly suited for this because they represent executable logic.
When an activity diagram includes precise control flow and data types, it can be transformed into boilerplate code. This reduces the manual effort of writing repetitive logic. For example, a workflow for order processing can generate the skeleton for an API controller, the service layer, and the database transaction manager.
The benefits of this automation include:
- Consistency: Generated code follows a standard pattern.
- Speed: Reduces initial setup time for new features.
- Maintenance: Changing the diagram updates the code base.
There are limitations. Business logic often contains nuances that are hard to capture in a standard notation. Human review remains essential. The diagram drives the structure, but developers fill in the logic. This hybrid approach balances automation with flexibility.
The Impact of Artificial Intelligence on Modeling 🧠
Generative AI is reshaping how software is built. It is also impacting how systems are documented. AI tools can now interpret natural language requirements and generate initial activity diagram structures. This lowers the barrier to entry for creating visual models.
Imagine describing a workflow in plain text. An AI agent interprets the intent, identifies the actors, and maps the decision points. It produces a draft diagram that the architect refines. This accelerates the design phase significantly.
Furthermore, AI can analyze existing codebases and reverse-engineer activity diagrams. This creates a bridge between legacy code and modern documentation. If a system lacks documentation, AI can scan the repository, identify the control flow, and generate a visual representation. This aids in onboarding new team members and understanding complex legacy systems.
Future capabilities may include:
- Automated Updates: Detecting code changes and suggesting diagram updates.
- Validation: Checking the diagram against the code for logical errors.
- Optimization: Suggesting more efficient flow structures based on performance data.
Challenges in Modern Adoption ⚠️
Despite the potential, several hurdles prevent widespread adoption of activity diagrams in modern teams. Understanding these challenges is crucial for realistic implementation.
Maintenance Overhead: Keeping diagrams up to date requires discipline. If the code changes and the diagram does not, the diagram becomes misleading. Teams must decide if the value of the visual outweighs the cost of maintenance.
Tooling Fragmentation: Many modeling tools are disconnected from the development environment. A workflow that requires exporting to a separate application creates friction. Integration with IDEs is necessary for seamless updates.
Abstraction Gaps: Diagrams simplify reality. Complex error handling, race conditions, and security constraints may be too intricate for a standard activity diagram. Developers must know when to stop modeling and start coding.
Traditional vs. Modern Usage Comparison 📋
| Feature | Traditional Approach | Modern Approach |
|---|---|---|
| Lifecycle | Design phase only | Continuous lifecycle |
| Ownership | Architects and Designers | Developers and DevOps |
| Format | Static Image/PDF | Executable/Interactive |
| Integration | Separate documentation store | Version control and CI/CD |
| Focus | Requirements specification | Runtime behavior and flow |
| Update Trigger | Major release | Commit or Pipeline change |
Best Practices for Implementation ✅
To succeed with activity diagrams in a modern context, teams should follow specific guidelines. These practices ensure the diagrams add value rather than becoming clutter.
- Keep it Simple: Avoid over-modeling. Focus on the critical paths. Details can be added in code comments or specific unit tests.
- Version Control: Store diagram files in the same repository as the source code. This ensures they are part of the same release cycle.
- Use Standard Notation: Stick to standard UML symbols where possible to ensure readability across different tools.
- Link to Code: Embed references to the actual code files or API endpoints within the diagram elements.
- Automate Checks: Use scripts to verify that the diagram matches the current state of the pipeline.
- Collaborative Editing: Use tools that allow multiple team members to edit the diagram simultaneously.
These practices reduce the risk of the documentation becoming a burden. They treat the diagram as a code artifact, subject to the same review and testing standards.
The Role of Observability 📈
Observability is the practice of understanding the internal state of a system from its external outputs. Activity diagrams intersect with observability by mapping expected flows against actual telemetry.
When a system behaves unexpectedly, the activity diagram serves as the baseline. Engineers can compare the actual trace against the modeled flow. Deviations indicate bugs, performance issues, or security breaches. This connection between design and runtime is where the notation gains its most significant modern value.
Visualizing metrics on the diagram is the next logical step. Instead of just showing the flow, show the latency at each node. Highlight where the bottleneck occurs. This transforms the diagram from a static map into a dashboard for system health.
Future Trends to Watch 👀
Several trends are shaping the future of this notation. Staying aware of these developments helps teams plan their modeling strategy.
- Real-Time Synchronization: Diagrams that update automatically as code is pushed.
- Cloud-Native Focus: Symbols specifically designed for serverless functions and container orchestration.
- Interoperability: Standardized file formats that work across all major modeling tools.
- Accessibility: Making diagrams readable by screen readers for inclusive documentation.
- Interactive Prototyping: Clicking on a node to simulate the action and see the outcome.
These trends point towards a system where the diagram is not just a picture, but an interactive interface for the system. It becomes a layer of abstraction that connects the business intent with the machine execution.
Final Thoughts on the Notation’s Viability 💭
The activity diagram is not a relic. It is a tool that requires the right context to shine. In complex systems, visualizing the flow of control is more important than ever. The complexity of modern software demands clear mental models for teams to collaborate effectively.
Success depends on integration. The diagram must live within the development ecosystem, not outside it. It must be updated by the team that writes the code. When these conditions are met, the activity diagram provides clarity in a chaotic environment.
Teams should adopt this notation pragmatically. Do not model everything. Model the critical paths, the complex logic, and the integration points. Use the diagram to facilitate discussion, not to replace it. As technology advances, the need for shared understanding remains constant. The notation adapts to meet that need.
Looking ahead, the convergence of AI, automation, and visual modeling will redefine how we document software. The activity diagram will likely become more dynamic and automated. It will move from being a design document to a runtime companion. This evolution ensures its place in the future of software engineering.
For those leading technical teams, the decision is clear. Embrace the evolution. Integrate modeling into the pipeline. Train teams to see value in the visual representation of their work. By doing so, you build a foundation for scalable, maintainable, and understandable systems.