
Computer Science students often encounter a disconnect between abstract programming logic and real-world business operations. While code executes instructions, business processes dictate the flow of value. Understanding this distinction is critical for effective system analysis and design. Activity diagrams serve as a vital tool in bridging this gap, offering a visual representation of workflows that transcends mere syntax. This guide explores how these diagrams function within the context of business process modeling, providing a practical framework for students to apply in their academic and professional endeavors.
Understanding Activity Diagrams: The Foundation 🧩
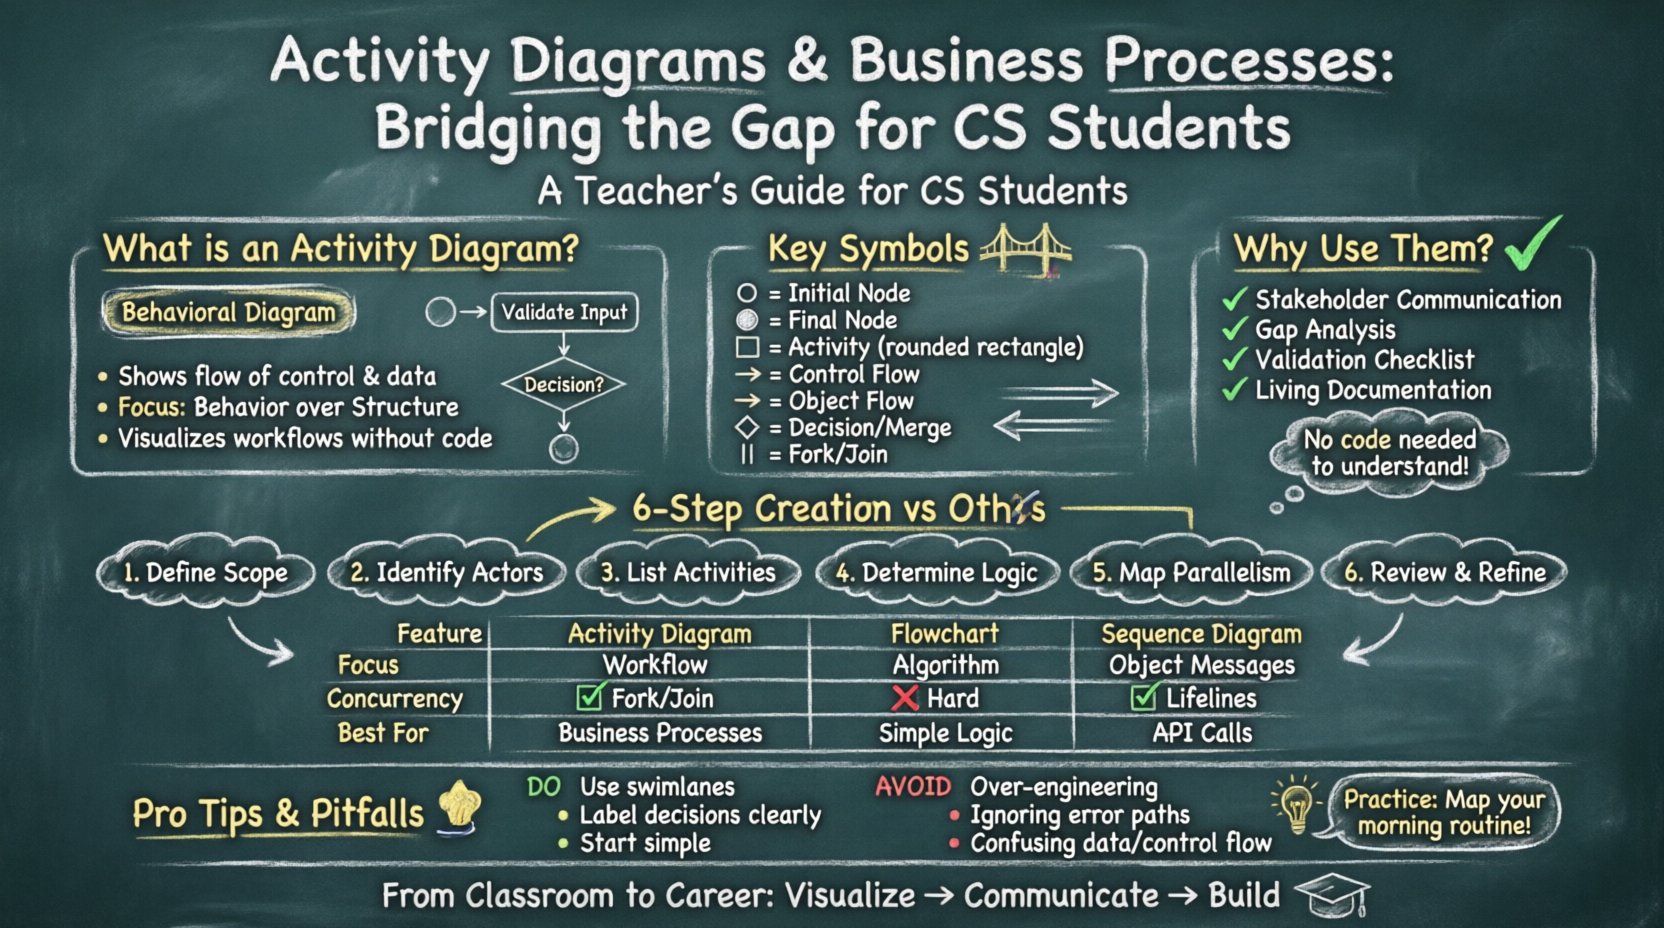
An activity diagram is a behavioral diagram that illustrates the flow of control and data from one activity to another. Unlike class diagrams which focus on structure, activity diagrams focus on behavior. They are particularly useful when modeling complex algorithms, use case details, or business workflows. For a computer science student, mastering this concept means moving beyond static code structures to dynamic system interactions.
Consider the lifecycle of a data request. A simple variable assignment is a step. A complex transaction involving authentication, validation, database updates, and notification is a process. Activity diagrams map these processes. They allow stakeholders to visualize the sequence of events without needing to read the underlying source code. This abstraction is essential for communication between developers, analysts, and business stakeholders.
Key Characteristics of Activity Diagrams
- Visual Clarity: They provide a clear path from start to finish.
- Parallelism: They can represent concurrent activities using fork and join nodes.
- Decision Logic: They explicitly show branching paths based on conditions.
- Control Flow: They track the order of execution rather than just object relationships.
Anatomy of an Activity Diagram 🏗️
To create effective diagrams, one must understand the specific elements that constitute them. Each symbol carries a specific meaning regarding how the process moves. Ignoring these definitions can lead to ambiguous models that confuse rather than clarify.
1. Initial and Final Nodes
The process begins with an initial node, typically represented by a solid black circle. It signifies the entry point of the activity. Conversely, the final node, a solid black circle surrounded by a ring, marks the termination of the activity. A diagram may have multiple final nodes if the process can end in different states.
2. Activity Nodes
These are rounded rectangles representing a specific action or task. In a business context, this could be “Validate User Input” or “Process Payment.” Activity nodes can be simple or complex, potentially containing sub-activities.
3. Control Flow and Object Flow
Control flow arrows indicate the sequence of execution. Object flow arrows represent the movement of data or documents between activities. Distinguishing between these two is crucial for accurate modeling.
4. Decision and Merge Nodes
Decision nodes (diamonds) introduce branching logic. They allow the process to split based on a condition, such as “Is Balance Sufficient?”. Merge nodes combine these branches back into a single path once the conditions are resolved.
5. Fork and Join Nodes
Fork nodes split a single flow into multiple parallel flows. Join nodes synchronize these parallel flows, ensuring all paths complete before the process continues. This is vital for modeling concurrent system behaviors.
Mapping to Business Processes 🏢
For CS students, the transition from algorithm design to business process modeling requires a shift in perspective. Algorithms focus on correctness and efficiency. Business processes focus on value delivery and compliance. Activity diagrams are the language that translates between these two domains.
When modeling a business process, the goal is to identify bottlenecks, redundancies, and handoff points. An activity diagram makes these visible. It allows a student to see where a process waits for human intervention or where it depends on a specific external system.
Benefits of Using Activity Diagrams for Business Logic
- Stakeholder Communication: Non-technical stakeholders can understand the flow without reading documentation.
- Gap Analysis: It becomes easier to see where requirements do not match the implemented flow.
- Validation: The diagram serves as a checklist to ensure all scenarios are covered.
- Documentation: It provides a living record of how the system is intended to behave.
Step-by-Step Creation Guide 📝
Creating a meaningful diagram requires a structured approach. Rushing into drawing symbols often leads to disorganized models. Follow these steps to ensure accuracy and utility.
- Define the Scope: Determine where the process starts and ends. Is it the entire order fulfillment or just the payment step?
- Identify Actors: Who or what initiates the activity? Is it a user, a timer, or an external system?
- List Activities: Break the process down into granular tasks. Avoid overly broad steps.
- Determine Logic: Identify where decisions occur. What conditions change the path?
- Map Parallelism: Identify tasks that can happen simultaneously.
- Review and Refine: Walk through the diagram logically to ensure no dead ends or loops exist.
Comparison: Activity Diagram vs. Other Models ⚖️
Students often confuse activity diagrams with flowcharts or sequence diagrams. While they share similarities, their purposes differ. Understanding these distinctions prevents misuse of the tools.
| Feature | Activity Diagram | Flowchart | Sequence Diagram |
|---|---|---|---|
| Primary Focus | Workflow and Control Flow | Algorithm Logic | Object Interaction Over Time |
| Concurrency | Supported via Fork/Join | Complex to represent | Supported via Overlapping Lifelines |
| Business Context | High (Process Oriented) | Medium (Logic Oriented) | Low (System Oriented) |
| Best Used For | Business Processes, Use Cases | Simple Algorithms | API Interactions, Method Calls |
While flowcharts focus heavily on the logical steps of a specific algorithm, activity diagrams are broader. They encompass the context of the system, including object flows and parallel processing. Sequence diagrams focus on the timing of messages between objects, whereas activity diagrams focus on the flow of control.
Common Mistakes by Students 🚫
Academic assignments often reveal specific patterns of error. Being aware of these pitfalls can improve the quality of a student’s work significantly.
- Over-Engineering: Trying to model every single detail of a function. Activity diagrams should be high-level enough to be readable.
- Ignoring Parallelism: Modeling everything sequentially when parts of the process occur simultaneously.
- Confusing Data with Control: Drawing object flows where control flows are required, or vice versa.
- Missing Error Paths: Focusing only on the “happy path” and ignoring exceptions or failure states.
- Creating Infinite Loops: Failing to define clear exit conditions for iterative processes.
Practical Application Scenarios 💡
To solidify understanding, consider how these diagrams apply to real-world scenarios encountered in software development.
Scenario 1: E-Commerce Checkout
This process involves multiple actors: the customer, the payment gateway, and the inventory system. An activity diagram would show the customer entering details, the system validating stock, the payment processing, and the inventory update. It would highlight where the process pauses for payment confirmation and where it branches if payment fails.
Scenario 2: User Authentication
Authentication is a critical security component. The diagram would detail the login attempt, the check against the database, the validation of credentials, and the generation of a session token. It would also show the branch for failed attempts, potentially leading to account lockout after multiple failures.
Scenario 3: Data Synchronization
In distributed systems, data must be kept consistent. An activity diagram can model the trigger event, the data collection phase, the comparison phase, and the update phase. It would effectively show if these steps happen in parallel across different nodes.
Best Practices for Academic Success 📚
When submitting diagrams for grading or review, presentation matters as much as technical accuracy. Adhering to standards ensures the diagram is interpreted correctly.
- Consistency: Use the same symbols and notation throughout the entire document.
- Readability: Arrange the flow to minimize crossing lines. Use swimlanes if multiple actors are involved.
- Labels: Ensure every decision node has a clear label indicating the condition (e.g., “True”, “False” or specific values).
- Iterative Refinement: Start with a rough sketch and refine it. Do not expect the first draft to be perfect.
- Contextual Notes: Add annotations if a specific activity requires complex logic that cannot be easily drawn.
Integrating with Software Development Life Cycle 🔗
Activity diagrams are not isolated artifacts; they fit into the broader Software Development Life Cycle (SDLC). They are typically created during the analysis and design phases.
- Requirement Analysis: They help clarify ambiguous requirements by visualizing them.
- System Design: They guide the architect in planning the workflow of components.
- Implementation: Developers use them to understand the expected behavior before writing code.
- Testing: Test cases are often derived directly from the paths shown in the activity diagram.
This integration ensures that the design intent is preserved from the initial concept through to the final deployment. It reduces the risk of deviation between what was planned and what was built.
Advanced Considerations for Complex Systems 🔍
As systems grow in complexity, simple activity diagrams may become insufficient. Advanced modeling techniques can address this.
- Subgraphs: Complex activities can be encapsulated in subgraphs to reduce clutter.
- State Machines: For processes with complex state dependencies, combining activity diagrams with state machines may be necessary.
- Concurrency Levels: Deeply nested parallel flows require careful synchronization points to prevent race conditions.
Students should understand when to stop refining a diagram. A diagram that is too detailed becomes a specification of the code, losing its value as a high-level design tool.
Final Considerations for Future Developers 💼
Mastery of activity diagrams is not just about passing exams; it is about preparing for professional practice. In a collaborative environment, the ability to visualize a process is a leadership skill. It allows a developer to lead discussions on system architecture and process efficiency.
Focus on the clarity of communication. A diagram that is easy to understand is more valuable than one that is technically perfect but confusing. Always prioritize the needs of the audience, whether they are fellow engineers or business managers.
Continue to practice by modeling real-world processes you encounter. Map out your morning routine, a library checkout, or a coffee shop order. These exercises build the intuition needed for complex system modeling.
By grounding your technical skills in practical business logic, you position yourself as a versatile engineer capable of bridging the divide between code and commerce. This capability is highly sought after in the industry.