
In the landscape of system architecture, visual clarity is not merely an aesthetic choice; it is a functional necessity. Activity diagrams serve as the backbone for understanding workflow logic, data flow, and process behavior within complex software ecosystems. As systems grow in size and complexity, the diagrams representing them must evolve alongside them. This guide explores the core principles required to design activity diagrams that maintain readability, accuracy, and utility as the underlying system scales.
Many teams treat activity diagrams as static snapshots of a moment in time. However, effective modeling requires a dynamic perspective. The goal is to create models that do not become obsolete when requirements shift. By adhering to specific design principles, you ensure that documentation remains a reliable resource for developers, stakeholders, and auditors alike.
Foundational Principles for Scalable Modeling 🏗️
Scalability in modeling is distinct from scalability in code. It refers to the ability of the diagram to handle increased complexity without becoming visually chaotic or semantically ambiguous. To achieve this, several foundational concepts must be applied from the outset.
1. Modularity and Decomposition
Attempting to represent an entire enterprise system in a single activity diagram is a common error. Such diagrams quickly become unmanageable. Instead, apply the principle of modularity.
- Break Down Processes: Divide complex workflows into smaller, logical sub-processes.
- Define Boundaries: Clearly mark where one sub-process ends and another begins.
- Use Nested Flows: Utilize call behaviors or subflows to represent detailed logic within a parent node.
When a user initiates a request, the top-level diagram should show the high-level path. Detailed validation logic, payment processing, or database transactions should reside in separate, linked diagrams. This keeps the primary view clean while retaining access to depth when needed.
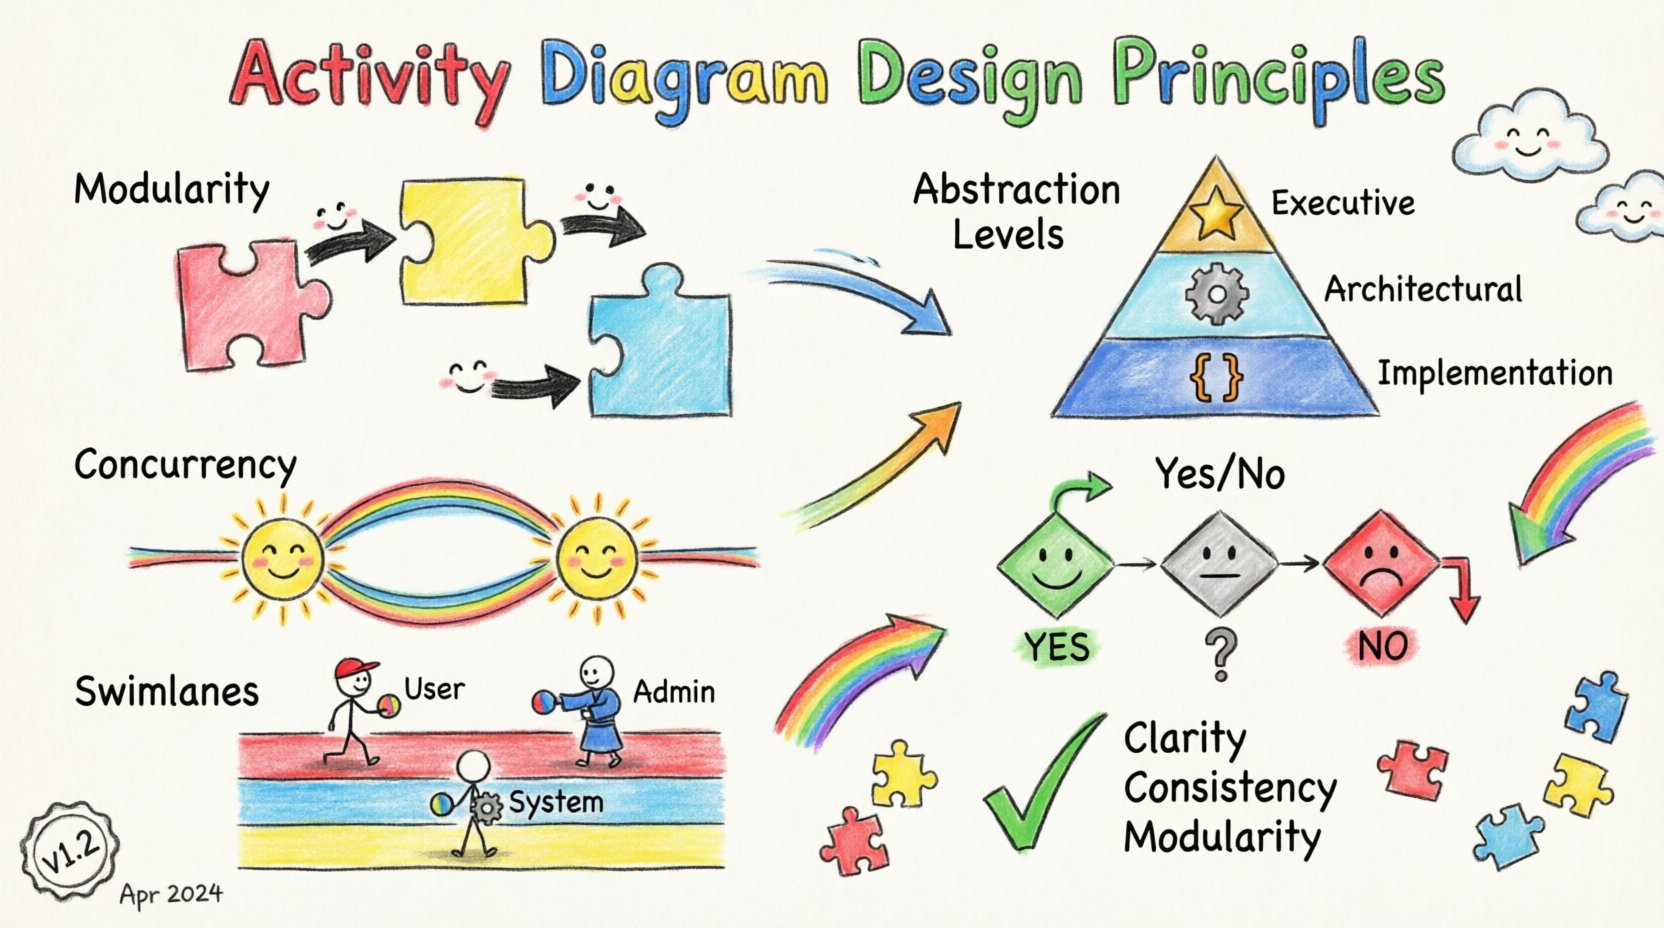
2. Abstraction Levels
Not every audience needs the same level of detail. A scalable diagram strategy involves maintaining different abstraction levels for different stakeholders.
- Executive View: Focus on entry and exit points, major milestones, and decision gates.
- Architectural View: Include system boundaries, component interactions, and major data transformations.
- Implementation View: Detail specific algorithms, error handling paths, and loop conditions.
By separating these views, you prevent the “information overload” that often renders diagrams useless. Each layer serves a specific purpose without cluttering the others.
3. Consistency in Notation
Inconsistency creates cognitive friction. If one swimlane represents a user and another represents a database in one section, but the symbols change in another, the modeler wastes time decoding the diagram rather than understanding the flow.
- Standardize Symbols: Use standard shapes for actions, decisions, and forks.
- Uniform Labeling: Adopt a naming convention for all nodes (e.g., Verb-Noun format).
- Color Coding: If color is used, assign it a specific semantic meaning (e.g., red for failure paths, green for success paths) and stick to it.
Structural Elements and Flow Control 🔄
The mechanics of how elements connect dictate the readability of the model. While the underlying software may vary, the logic remains constant. Understanding how to manage control flow is critical for maintaining a scalable design.
Managing Concurrency
Modern systems are rarely sequential. They handle multiple tasks simultaneously. Activity diagrams must represent this concurrency without creating a “spaghetti” effect.
- Fork and Join Nodes: Use these to clearly indicate where a single flow splits into parallel threads and where they converge.
- Synchronization: Ensure join nodes specify whether they wait for all incoming flows or just one.
- Resource Constraints: If parallel threads compete for a resource, indicate this constraint near the fork point.
Decision and Merge Logic
Decision diamonds are the branching points of logic. Overusing them or placing them incorrectly leads to high cyclomatic complexity, making the path difficult to trace.
- Binary Decisions: Keep decisions to true/false or yes/no where possible to minimize branching.
- Guard Conditions: Label every outgoing edge with a clear condition. Avoid leaving edges unlabeled.
- Consolidate Paths: Merge decision paths as soon as possible. If two paths lead to the same outcome, merge them immediately rather than carrying separate lines.
The Role of Swimlanes
Swimlanes organize activity by responsibility. In a scalable system, the number of swimlanes can become unwieldy. Use them judiciously.
| Swimlane Strategy | Best Use Case | Scalability Risk |
|---|---|---|
| Organizational | Teams or departments (e.g., Sales, Engineering) | High risk if teams restructure frequently. |
| Functional | Roles (e.g., Admin, User, System) | Low risk; more stable over time. |
| System Component | Microservices or modules | Medium risk; depends on service mesh stability. |
For highly scalable systems, functional swimlanes often prove more durable than organizational ones, as roles tend to persist longer than team structures.
Handling Complexity and Maintenance 🛠️
A diagram is a living document. As the system evolves, the diagram must be updated. If the diagram is too complex to update, it will become outdated, and its value will vanish. Maintenance strategies are therefore a core design principle.
Reference Reusable Logic
Common workflows appear repeatedly across a system. Instead of redrawing the same sequence of steps, create a reference activity.
- Define Once: Create a detailed sub-flow for standard processes (e.g., “User Authentication”).
- Call Everywhere: Reference this sub-flow wherever it occurs in the main diagram.
- Update Once: When the process changes, update the sub-flow definition. All references update automatically.
This approach drastically reduces redundancy and ensures consistency across the documentation suite.
Versioning and Change Management
Since diagrams represent logic, they should be versioned alongside code. This allows teams to trace when a specific workflow logic was introduced or altered.
- Metadata: Include version numbers and dates on the diagram header.
- Change Logs: Maintain a log detailing what changed between versions.
- Deprecation: Clearly mark obsolete flows with a visual indicator (e.g., a strikethrough or grayed-out section) before removing them entirely.
Readability Metrics
To ensure a diagram remains maintainable, apply simple metrics to gauge its complexity.
- Node Count: If a single page exceeds 50 nodes, it is likely too dense.
- Path Length: Average the number of steps between entry and exit. Long paths indicate a need for decomposition.
- Cross-Lane Traffic: Minimize lines crossing multiple swimlanes. High crossing rates suggest a need to regroup responsibilities.
Common Pitfalls to Avoid ⚠️
Even experienced modelers fall into traps that reduce the utility of their diagrams. Recognizing these anti-patterns is key to maintaining quality.
The “God Diagram”
This is the attempt to map every single function of a system onto one page. The result is a tangled web that no one can read.
- Solution: Ruthlessly decompose. If it does not fit comfortably on a standard page, it belongs in a separate diagram.
Dead Ends and Loops
Every flow should have a defined exit. Infinite loops or paths that lead nowhere indicate a logical error in the model.
- Validation: Check every path to ensure it terminates.
- Exception Handling: Ensure error paths lead to a recovery state or a clear termination point.
Implicit Dependencies
Do not assume the reader knows the context. If a step relies on external data or a state from a previous process, document that dependency explicitly.
- Input/Output: Clearly label data entering and leaving the activity.
- State Requirements: Specify what must be true before an action can begin.
Integration with Other Models 🔗
An activity diagram does not exist in isolation. It is part of a broader system design ecosystem. Aligning it with other models enhances its value.
Relationship with Use Case Diagrams
Use case diagrams define what the system does from a user perspective. Activity diagrams define how it does it internally. Use the use case as the trigger for the activity diagram.
- Trigger: The start of the activity diagram should correspond to the entry point of the use case.
- Scope: The activity diagram covers the internal logic required to fulfill the use case.
Relationship with Class Diagrams
Class diagrams define the static structure. Activity diagrams define the dynamic behavior. Ensure that the objects manipulated in the activity diagram exist in the class diagram.
- Object Lifecycles: Track how objects change state during the activity.
- Method Calls: Actions in the diagram should map to methods defined in the class structure.
State Machine Integration
Some behaviors are better represented by state machines (e.g., order status). Use activity diagrams for the workflow that transitions between states.
- Trigger Events: Activity steps often trigger state transitions.
- Guard Conditions: State transitions often rely on the outcomes of activity decisions.
Best Practices Checklist ✅
Before finalizing a diagram, run through this checklist to ensure it meets scalability standards.
- Clarity: Can a new team member understand the flow within 5 minutes?
- Completeness: Are all error paths accounted for?
- Consistency: Are symbols and naming conventions uniform?
- Modularity: Is the logic split into manageable sub-flows?
- Alignment: Does the diagram match the current system architecture?
- Maintainability: Is it easy to update when requirements change?
- Accessibility: Are the diagrams accessible to all stakeholders (non-technical and technical)?
Future-Proofing Your Models 🚀
The software landscape changes rapidly. New integration patterns, cloud architectures, and API standards emerge constantly. Your activity diagrams must be resilient to these changes.
- Focus on Logic, Not Technology: Describe the business logic rather than specific implementation details (e.g., “Validate User” instead of “Check LDAP Database”). This decouples the model from specific infrastructure changes.
- Abstract Interfaces: When defining interactions with external systems, treat them as black boxes. Define the input and output, not the protocol details, unless the protocol is critical to the logic.
- Regular Audits: Schedule periodic reviews of your diagrams. Compare them against the actual running system to ensure they have not drifted.
By focusing on these principles, you create a documentation framework that supports the system throughout its lifecycle. The diagram becomes a tool for communication and validation, rather than a static artifact that gathers dust.
Summary of Key Takeaways 📝
- Decompose complex processes into modular sub-flows to prevent visual clutter.
- Maintain consistent notation and labeling conventions across all diagrams.
- Use swimlanes to clarify responsibility but avoid over-segmenting.
- Integrate activity diagrams with use cases and class diagrams for a holistic view.
- Version your diagrams and treat them as living documents subject to change management.
- Focus on business logic over technical implementation details to ensure longevity.
Building scalable system models requires discipline and a clear understanding of the underlying architecture. When applied correctly, activity diagrams provide a powerful lens through which to view, analyze, and improve your software systems.