Activity diagrams serve as the backbone of process visualization in system design. They translate abstract logic into concrete flowcharts, allowing stakeholders to understand the dynamic behavior of a system without getting lost in code. However, a diagram that is too dense or poorly structured defeats its purpose. When models become cluttered, maintenance costs rise, and communication breaks down. This guide outlines proven strategies to ensure your activity diagrams remain functional, clear, and maintainable over time.
🎯 Why Diagram Readability Matters
A well-structured activity diagram does more than show steps; it tells a story about data flow, decision logic, and concurrency. If a developer or business analyst spends ten minutes deciphering a single path, the diagram has failed. Clean modeling reduces cognitive load and accelerates the design review process. It also facilitates better documentation, making it easier to onboard new team members.
Readability is not just about aesthetics; it is about information architecture. Every element on the canvas should have a purpose. If a line, node, or label does not contribute to the understanding of the process, it should be reconsidered. Maintaining this discipline requires consistent application of specific rules regarding layout, naming, and complexity management.
🛠️ Foundational Structure and Nodes
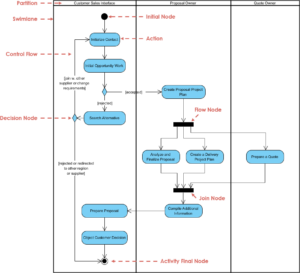
Every activity diagram begins with a clear entry point and ends with a definitive outcome. Proper use of initial and final nodes establishes boundaries for the process flow. Skipping these steps can lead to confusion about where the process starts or how it terminates.
Initial and Final Nodes
- Initial Node: Represented by a solid black circle. This marks the single entry point for the activity. While some models allow multiple starting conditions, a single initial node is generally preferred for clarity.
- Final Node: Represented by a black circle with a surrounding ring. This indicates the successful completion of the activity. For complex processes, you may use multiple final nodes to represent different termination states (e.g., Success, Cancelled, Error).
Ensure that every path eventually converges to a final node. Orphaned flows that terminate without a final node suggest incomplete logic. Conversely, ensure that the initial node is not connected directly to another activity without a control flow action if a decision is involved.
Action States and Object Flows
Activities are represented by rounded rectangles. Labels within these boxes should describe an action using a verb-noun structure (e.g., Process Payment, not Payment). This distinction ensures the diagram focuses on behavior rather than static data.
- Verb-Noun Convention: Use active verbs. Instead of Calculate, use Calculate Tax. This reduces ambiguity.
- Object Flows: When data moves between activities, use object flows. These should be labeled with the data type (e.g., Invoice Data). Do not clutter the diagram with every single variable; only show data that is critical to the logic.
🏷️ Naming and Labeling Conventions
Consistency in naming is the easiest way to improve readability. When a team works on a model, everyone should follow the same lexicon. This prevents scenarios where one part of the diagram calls a step Validate User and another calls it Check Credentials. Consistency reduces the mental effort required to map the diagram to the actual implementation.
Flow Labels and Guard Conditions
Decision nodes (diamonds) require outgoing flows with guard conditions. These labels define the logic for taking a specific path. If you have two paths, label them Yes/No or True/False. If you have more than two, use specific conditions like Balance > 0 or Invalid ID.
- Brevity: Keep guard conditions short. If the logic is complex, move the explanation to the diagram comments or a separate specification document.
- Completeness: Ensure all possible outcomes are covered. If a decision node has two outgoing flows, they must cover all logical possibilities unless one path represents an error condition explicitly.
- Consistency: Use the same terminology for similar conditions across the entire diagram.
🌊 Managing Complexity with Swimlanes
As processes grow, single-flow diagrams become unreadable. Swimlanes (also known as partitions) organize activities by actor, department, or system component. This structure clarifies responsibility and highlights handoffs between different parts of the system.
Partition Strategies
Decide on a partitioning strategy before drawing. Common approaches include:
- Organizational: Lanes represent teams or departments (e.g., Frontend, Backend, Database).
- System: Lanes represent specific software modules or services.
- Chronological: Lanes represent phases of the project (e.g., Analysis, Development, Testing).
Once lanes are established, keep activities within them. Do not cross lanes arbitrarily. If an action must move from one lane to another, the control flow should clearly cross the boundary, indicating a handoff.
Handling Cross-Lane Interactions
Excessive crossing of flow lines between swimlanes creates a visual mess known as a “hairball.” To mitigate this:
- Minimize Connections: Where possible, group related actions within the same lane.
- Use Objects: Use object flows to represent data passing between lanes rather than control flows for data movement.
- Separate Concerns: If a process involves too many cross-lane interactions, consider splitting the activity into multiple sub-activity diagrams.
⚙️ Control Flow Logic
The heart of an activity diagram is the logic that drives the process. This involves decisions, merges, forks, and joins. Misusing these elements leads to deadlocks or infinite loops. Understanding the difference between concurrency and parallelism is crucial for accurate modeling.
Decisions vs. Merges
A decision node (diamond) splits a flow based on a condition. A merge node combines multiple flows back into a single path. It is vital to ensure that merges and decisions are paired correctly.
- Pairing: Every split should eventually merge, unless it represents a distinct termination path.
- Logic: Ensure that all incoming flows to a merge node lead to the same subsequent action. If the logic diverges significantly after the merge, you may need to split the diagram further.
Forks and Joins
Forks create parallel threads of execution. Joins synchronize these threads. A thick black bar indicates a fork or join.
- Synchronization: A join waits for all incoming flows to arrive before proceeding. If one flow is significantly slower or takes a different path, the join must account for this.
- Concurrent vs. Sequential: Do not confuse sequential steps with parallel ones. If Step A must finish before Step B starts, do not use a fork. Use a standard control flow.
- Deadlocks: Be wary of circular dependencies in parallel flows. If Thread 1 waits for Thread 2 and vice versa, the system hangs. Model this carefully.
🎨 Visual Hygiene and Layout
Even with perfect logic, a diagram can fail if the visual presentation is poor. Visual hygiene involves spacing, alignment, and line management. The goal is to make the diagram easy to scan.
Flow Direction
Establish a consistent flow direction. The standard is top-to-bottom or left-to-right. Avoid zig-zagging flows unless necessary to fit the page. Consistent direction helps the eye track the process naturally.
- Top-Down: Best for sequential processes.
- Left-to-Right: Useful for long horizontal processes or when space is limited vertically.
Line Management
Control flows should be orthogonal (horizontal or vertical lines only). Avoid diagonal lines where possible, as they look less structured. When lines must cross, use a bridge or a dot to indicate connection versus crossing.
Spacing and Alignment
- Even Spacing: Keep nodes evenly spaced. Clustering nodes makes it hard to read.
- Alignment: Align nodes vertically or horizontally where possible. This creates a grid-like structure that is pleasing to the eye.
- White Space: Do not fear empty space. White space separates distinct logical blocks.
📋 Common Pitfalls and Anti-Patterns
Avoiding common mistakes is as important as following best practices. Below is a table summarizing frequent errors and their corrections.
| Anti-Pattern | Issue | Recommended Solution |
|---|---|---|
| Overloaded Nodes | A single action box contains too much logic. | Break down complex actions into sub-activities or separate diagrams. |
| Unreachable Paths | Some flows cannot be reached from the start. | Trace all paths from the initial node to identify dead ends. |
| Missing Error Handling | No path exists for failure scenarios. | Include exception flows and termination nodes for errors. |
| Text Overload | Boxes are filled with paragraphs of text. | Use concise labels. Move details to documentation. |
| Redundant Loops | Loops that do not change state or progress. | Ensure loops have a clear exit condition and progress. |
🔍 Documentation and Maintenance
Diagrams are living documents. They evolve as the system changes. A model that is not maintained becomes a liability. Regular reviews ensure the diagram reflects the current state of the system.
Versioning and Comments
- Annotations: Use notes or comments to explain complex logic that cannot be easily shown visually.
- Version Control: Treat diagrams like code. Store them in version control systems to track changes over time.
- Change Logs: Maintain a log of why changes were made to the model. This aids in future debugging.
Integration with Other Models
Activity diagrams do not exist in isolation. They should align with class diagrams, sequence diagrams, and use case diagrams.
- Consistency: Ensure that actors in the activity diagram match those in the use case diagram.
- Data Consistency: Objects used in activity flows should exist in the class diagram.
- Trigger Alignment: The initial node of an activity diagram should correspond to the trigger of a use case.
🧩 Complex Scenarios and Exceptions
Real-world systems are rarely linear. They involve exceptions, retries, and asynchronous operations. Modeling these scenarios requires specific techniques to keep the diagram clean.
Exception Handling
Instead of cluttering the main flow with every possible error, use exception flows. These can branch off from a specific activity. If an error occurs, the flow moves to an exception handler, which then decides whether to retry, log, or terminate.
- Centralized Handling: Where possible, route exceptions to a common handler to reduce branching.
- Specific vs. General: Handle specific errors where the fix differs. Group general errors where the response is the same.
Asynchronous Operations
When a process involves waiting for an external response (e.g., API call), use a wait state. Do not block the entire flow indefinitely. Represent the wait state clearly so it is understood that the process is paused, not stuck.
- Timeouts: If a wait is indefinite, model a timeout condition that routes to an error path.
- Callbacks: Represent asynchronous callbacks as separate flows that rejoin the main process once the response is received.
📏 Metrics for Readability
How do you measure if a diagram is too complex? Several metrics can help determine when a diagram needs to be split or refactored.
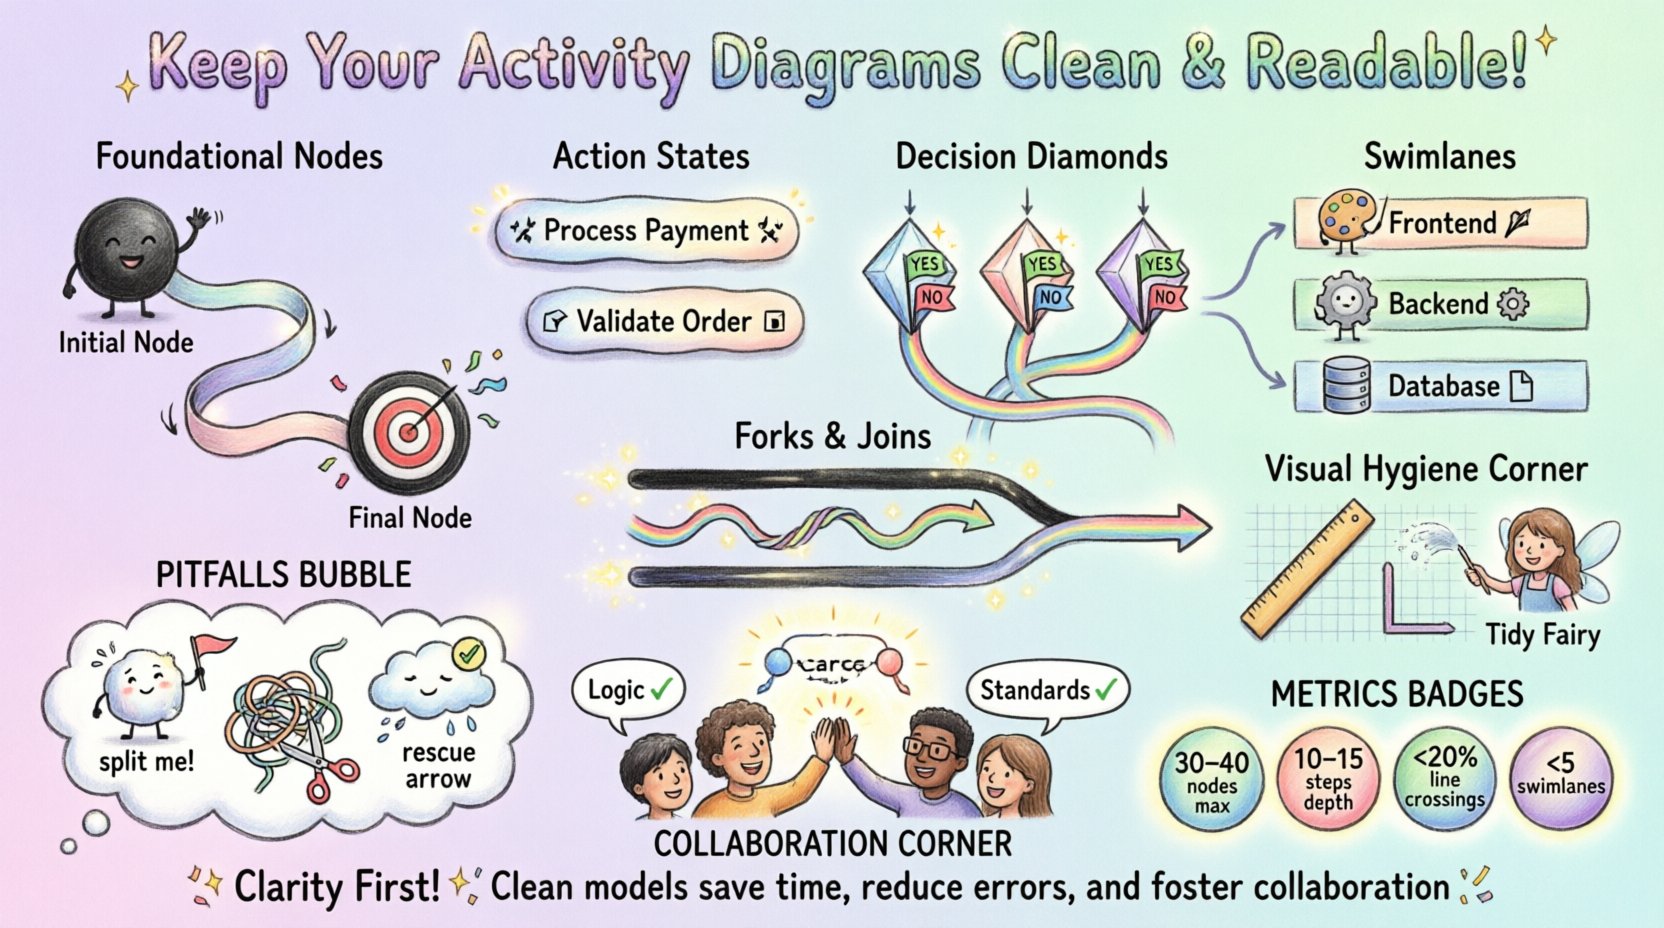
- Node Count: If a single diagram has more than 30-40 nodes, consider splitting it.
- Depth: If the maximum path length exceeds 10-15 steps, the logic is likely too nested.
- Crossing Lines: If more than 20% of flow lines cross other lines, the layout needs optimization.
- Swimlanes: If you have more than 5 swimlanes, the process may be too fragmented.
When these thresholds are reached, use the “Refactor” approach. Create a sub-activity diagram for the complex section. Call the sub-diagram from the parent diagram using an activity call behavior. This keeps the high-level view clean while retaining detail where needed.
🤝 Collaboration and Review
Creating a diagram is a team effort. Peer reviews are essential to catch inconsistencies and logical gaps. During a review, focus on the following:
- Logic Flow: Does the process actually work as described?
- Completeness: Are all edge cases covered?
- Clarity: Can a new stakeholder understand the diagram in 5 minutes?
- Standards: Does it follow the agreed-upon naming and layout guidelines?
Encourage feedback from developers who will implement the logic. They often spot ambiguities that architects miss. Incorporate their feedback to ensure the model is technically feasible.
🚀 Summary of Guidelines
To maintain high-quality activity diagrams, adhere to the following core principles:
- Start and End Clearly: Always define entry and exit points.
- Use Verbs: Label actions with active verbs.
- Limit Complexity: Split diagrams when they grow too large.
- Standardize Layout: Use consistent flow directions and orthogonal lines.
- Manage Concurrency: Use forks and joins correctly for parallel processes.
- Review Regularly: Keep diagrams updated with system changes.
- Document Logic: Use comments for complex rules.
- Align with Models: Ensure consistency with other UML diagrams.
By following these practices, you ensure that your activity diagrams remain valuable assets for communication and development. They become tools for understanding rather than obstacles to progress. A clean model saves time, reduces errors, and fosters better collaboration across the entire team. Focus on clarity above all else, and the technical details will follow naturally.