Understanding how software components interact is fundamental to system architecture. While static views define the structure of a system, dynamic views explain how that structure behaves over time. Among the various modeling techniques available, the communication diagram stands out for its ability to visualize object interactions without the strict time-line constraints of other notations. This guide explores the mechanics, syntax, and practical application of communication diagrams within the Unified Modeling Language (UML) framework.
Whether you are designing a distributed system or documenting a legacy codebase, mastering the visual representation of message flow is essential. We will examine the core components, the rules governing message sequencing, and how this diagram type compares to alternatives. By the end of this resource, you will have a clear understanding of how to construct these diagrams effectively without relying on specific software tools.
What is a Communication Diagram? 🤔
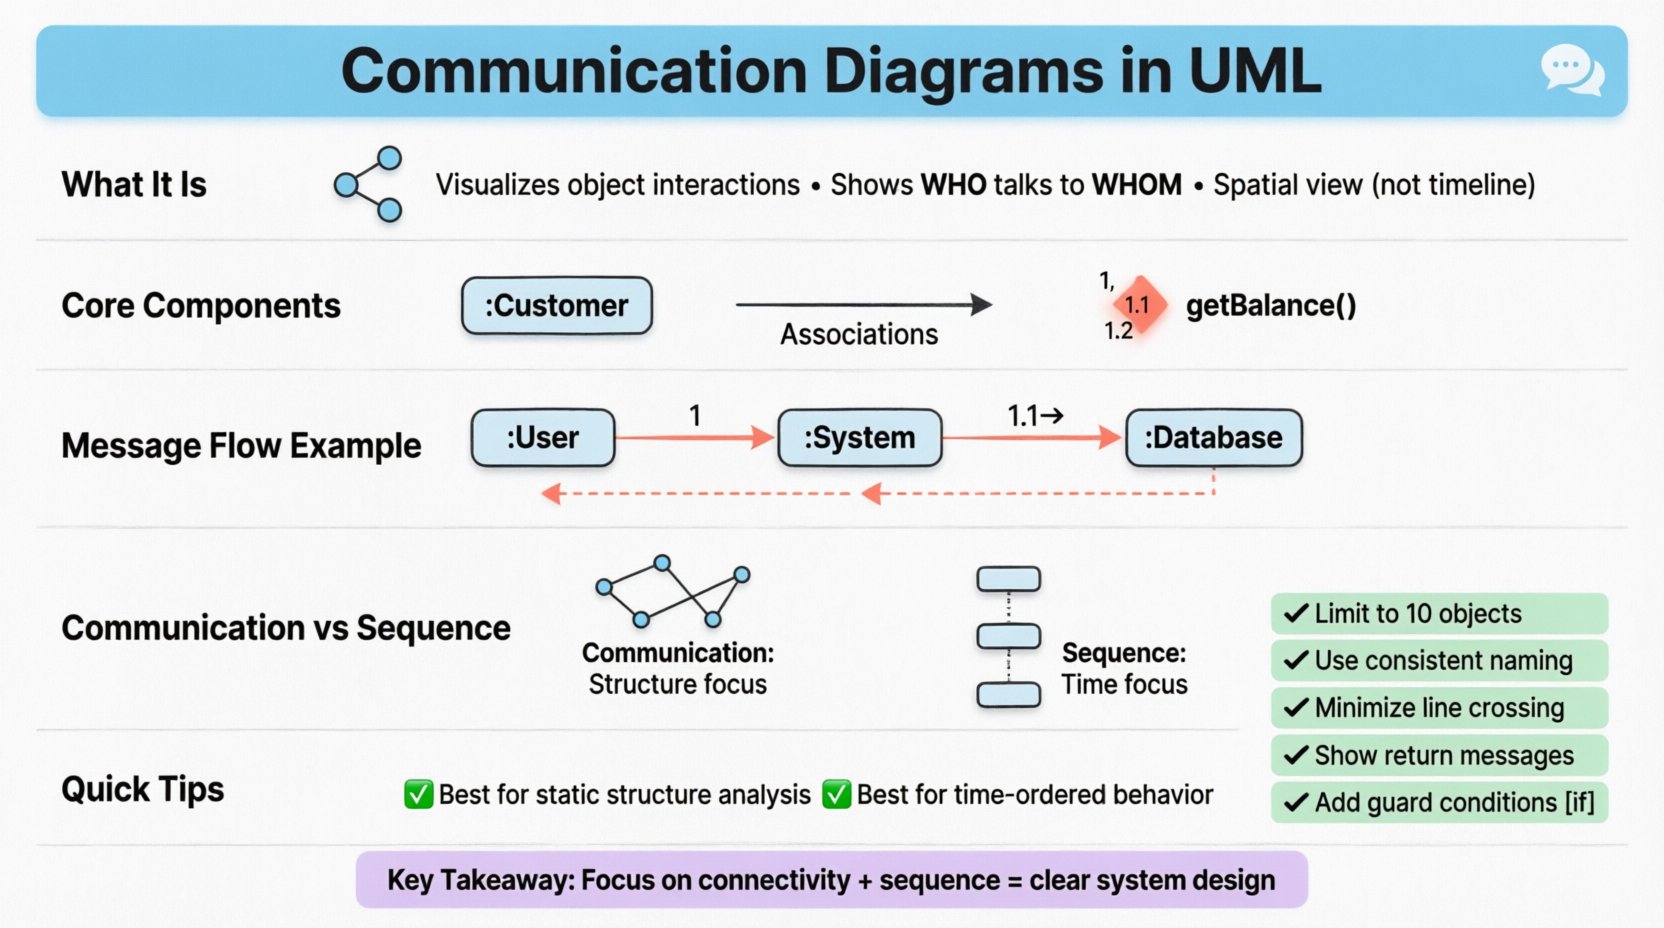
A communication diagram, formerly known as a collaboration diagram, is a behavioral diagram within the UML standard. It depicts the interactions between objects or parts in terms of sequenced messages. Unlike a sequence diagram, which emphasizes the chronological order of events on a vertical time axis, the communication diagram prioritizes the structural organization of the objects involved.
This distinction is crucial for architects who need to understand not just when things happen, but who is talking to whom within the system topology. The diagram shows:
- The objects participating in the interaction.
- The links connecting these objects.
- The messages flowing between them.
- The multiplicity of instances involved.
The primary goal is to provide a spatial view of the interaction. This allows stakeholders to see the relationships between objects more intuitively, especially in complex systems where objects are scattered across different subsystems. It complements the sequence diagram by offering a different perspective on the same behavioral logic.
Core Components and Notation 🛠️
Constructing a valid communication diagram requires adherence to specific notational rules. Each element serves a distinct purpose in defining the system’s behavior. Below is a breakdown of the essential building blocks.
1. Objects and Instances
Objects represent the participants in the interaction. They are typically depicted as rectangles containing the object name, often preceded by a colon to indicate a specific instance (e.g., :Customer). The visual placement of these objects is flexible, allowing you to arrange them to minimize line crossing and maximize readability.
- Instance Name: Identifies the specific role within the scenario.
- Class Name: Implicitly defines the type of data the object holds.
- State: Some variations allow indicating the state of the object, though this is less common.
2. Links (Associations)
Links represent the connections between objects. These are not merely visual connectors; they represent actual associations defined in the class diagram. A link exists only if the objects are capable of communicating directly.
- Direction: Links are bidirectional by default, but arrows can indicate navigability.
- Role Name: Labels the link to clarify the relationship (e.g., partner, manager).
- Multiplicity: Indicates how many instances can be connected (e.g.,
1,0..*).
3. Messages
Messages are the arrows drawn between objects. They represent the transfer of data or control. Each message must have a sequence number to establish the order of execution.
- Sequence Number: A number followed by a dot (e.g.,
1,1.1,1.2) indicates the order. - Return Message: Represented by a dashed arrow pointing back to the sender.
- Label: Describes the operation being called (e.g.,
getBalance()). - Guard Conditions: Optional brackets
[condition]can define when a message is sent.
Structure and Logic of Message Flow 🔗
The logic behind a communication diagram relies on the sequential numbering of messages. This numbering system creates a virtual timeline, even though the spatial layout is not time-based. Understanding this logic is vital for accurate modeling.
Sequential Numbering Rules
The numbering must be consistent to avoid ambiguity. The rules are as follows:
- Main Flow: The primary sequence of messages starts with
1. - Sub-sequences: If an object sends a message before receiving the initial response, it is numbered
1.1,1.2, etc. - Parallel Flows: Independent interactions can start with
2or a higher number. - Repetitions: Loops are indicated by the keyword
loopsurrounding the relevant messages.
Consider a scenario where a user requests data. The request is message 1. The system processes it and sends a secondary request to a database. This secondary request is message 1.1. When the database responds, it is a return message for 1.1. Once the system aggregates the data, it sends the final response back to the user as the return for 1.
Handling Loops and Alternatives
Real-world logic often involves repetition or conditional branching. Communication diagrams handle these through specific annotations.
- Loop: A frame labeled
loopencloses messages that repeat. The iteration count can be specified (e.g.,for each item). - Opt: A frame labeled
optindicates an optional sequence. This is used when a message is only sent under certain conditions. - Alt: A frame labeled
altrepresents alternative paths (if/else logic). Each path is separated by a horizontal divider line. - Ref: A frame labeled
refrefers to another diagram or a detailed view of a complex interaction.
Comparison: Communication vs. Sequence Diagrams 📊
Selecting the right diagram type depends on the information you need to convey. Both diagrams describe the same interactions, but their presentation differs significantly. The following table outlines the key distinctions.
| Feature | Communication Diagram | Sequence Diagram |
|---|---|---|
| Focus | Structural relationships and object roles | Chronological order and timing |
| Layout | Flexible spatial arrangement | Vertical time axis (top to bottom) |
| Complexity | Harder to read with many objects | Better for complex, long sequences |
| Message Labels | Numbered explicitly (1, 1.1) | Implicitly ordered by position |
| Use Case | Understanding object connectivity | Understanding event timing |
When the focus is on understanding which objects are connected and how they relate structurally, the communication diagram is superior. However, if the scenario involves intricate timing dependencies or a very long chain of events, the sequence diagram often provides better clarity.
Step-by-Step Construction Guide 📝
Creating a robust diagram requires a methodical approach. Follow these steps to ensure accuracy and consistency.
Step 1: Define the Scope and Actors
Begin by identifying the specific scenario you are modeling. Is it a login process? A data export function? Define the external actors and the internal objects involved. Do not include unnecessary objects that do not participate in the interaction.
Step 2: Place Objects Strategically
Arrange the object rectangles on the canvas. Place the initiating object on the left or top. Group related objects together to minimize the length of the connecting lines. The goal is to create a clear map of the interaction topology.
Step 3: Draw the Links
Connect the objects with lines representing their associations. Ensure every message arrow has a corresponding link. If an object sends a message to another without a direct link, it violates the structural integrity of the system design.
Step 4: Add Messages and Numbers
Draw arrows for every interaction. Assign sequence numbers starting from 1. Ensure that sub-messages are numbered logically (e.g., 1.1 must belong to the flow initiated by 1). Use return arrows (dashed) to complete the transaction cycle.
Step 5: Review for Completeness
Check that all necessary return messages are present. Verify that guard conditions are marked where logic branches occur. Ensure that the diagram accurately reflects the business logic without introducing external dependencies.
Best Practices for Clarity and Maintenance 🚀
A diagram that is too complex becomes useless. Adhering to best practices ensures that the documentation remains maintainable and understandable over time.
- Limit Object Count: If a diagram requires more than 10 objects, consider splitting it into multiple smaller diagrams. Focus on one specific interaction flow per diagram.
- Use Consistent Naming: Object names should match the class names in the design documents. This reduces cognitive load when cross-referencing.
- Minimize Line Crossing: Use curved lines where necessary to prevent visual clutter. Overlapping lines make it difficult to trace message paths.
- Group Related Messages: If multiple messages occur between the same two objects, ensure they are grouped visually to indicate a cohesive transaction.
- Document Pre-conditions: Use text notes to specify any state requirements before the interaction begins. This adds context that the diagram arrows alone cannot convey.
Common Pitfalls to Avoid ⚠️
Even experienced modelers can make errors that compromise the utility of the diagram. Be aware of these common mistakes.
- Missing Return Messages: Failing to show the response to a message creates an incomplete picture of the data flow.
- Inconsistent Numbering: Skipping numbers (e.g., jumping from
1to3) confuses the reader about the sequence of events. - Circular Dependencies: While loops are valid, circular references in the diagram structure (A talks to B, B talks to A, A talks to B without a return) can indicate infinite recursion risks.
- Overloading Messages: A single message label should describe one specific action. Avoid combining multiple logical steps into one arrow.
- Ignoring Multiplicity: Failing to indicate how many objects are involved can lead to implementation errors regarding collection handling.
Application in System Design 🏗️
Communication diagrams serve several critical functions in the software development lifecycle.
1. Design Validation
During the design phase, these diagrams help validate that the proposed architecture supports the required interactions. If a message cannot be routed through the defined links, the design is flawed.
2. Code Generation Support
While not all tools support direct code generation from these diagrams, the detailed structure of object links provides developers with a clear map of dependency injection and interface implementation.
3. Debugging and Analysis
When debugging a runtime error, a communication diagram helps trace the path of execution. Developers can compare the actual runtime call stack against the diagram to identify where the flow deviated from the plan.
4. Stakeholder Communication
For non-technical stakeholders, the spatial arrangement of objects often makes more sense than a vertical timeline. It allows them to understand the system’s anatomy while viewing the interaction.
Integrating with Other UML Diagrams 🔗
A communication diagram does not exist in isolation. It is part of a larger ecosystem of models.
- Class Diagrams: The links in the communication diagram are derived directly from the associations in the class diagram. They must remain consistent.
- Use Case Diagrams: Each communication diagram typically corresponds to a specific use case scenario. The actors in the use case diagram often initiate the first message.
- State Machine Diagrams: The messages in the communication diagram often trigger state transitions in the participating objects.
Ensuring consistency across these diagrams is vital. If a class diagram changes to remove an association, the communication diagram must be updated to remove the corresponding links and messages. This synchronization maintains the integrity of the system specification.
Advanced Techniques for Complex Systems 🧠
For large-scale enterprise applications, standard diagrams may become insufficient. Advanced techniques can extend the utility of the communication diagram.
1. Partitioning
In distributed systems, partition the diagram by subsystem or service boundary. This clarifies which messages cross network boundaries and which remain internal.
2. Aggregation
Use aggregation frames to group multiple interactions into a single logical unit. This reduces clutter when discussing high-level business processes that involve many low-level steps.
3. Contextual Notes
Attach notes to specific messages to explain non-functional requirements, such as security constraints or performance expectations attached to that specific interaction.
Summary of Key Takeaways 📌
The communication diagram remains a powerful tool for visualizing object interactions. Its strength lies in its ability to show the structural relationships between objects while depicting the dynamic flow of messages. By focusing on the connectivity of the system, it complements the chronological focus of sequence diagrams.
Key points to remember include:
- Maintain strict sequence numbering to establish logical order.
- Ensure all links exist in the underlying class structure.
- Use frames for loops, alternatives, and references.
- Keep the diagram focused to avoid visual complexity.
- Update the diagram whenever the class structure changes.
By applying these principles, you can create documentation that accurately reflects the system’s behavior without introducing ambiguity. This clarity supports better decision-making throughout the development lifecycle, from initial design to final maintenance.
Whether you are mapping a simple module or a complex microservice architecture, the logic of the communication diagram provides a reliable foundation for understanding interaction patterns. Focus on the relationships, respect the sequence, and maintain the structural integrity of your models.