Developers spend countless hours writing code, yet the true complexity of a system often lies hidden within layers of functions and methods. When teams need to understand how components interact, text-based documentation often falls short. This is where visual representation becomes critical. A communication diagram offers a structured way to map object interactions, translating raw logic into a visual narrative that stakeholders can understand. This guide provides a comprehensive approach to extracting system behavior from code and rendering it into effective diagrams.
Understanding the Value of Visual Logic 🧠
Code is linear, but systems are often non-linear. While a developer might trace a function call through a file tree, a diagram allows a broader view of the ecosystem. Communication diagrams focus on the relationships between objects rather than the strict timing of events, making them ideal for showing the flow of data and control across a system architecture.
Why is this translation necessary? Consider the following points:
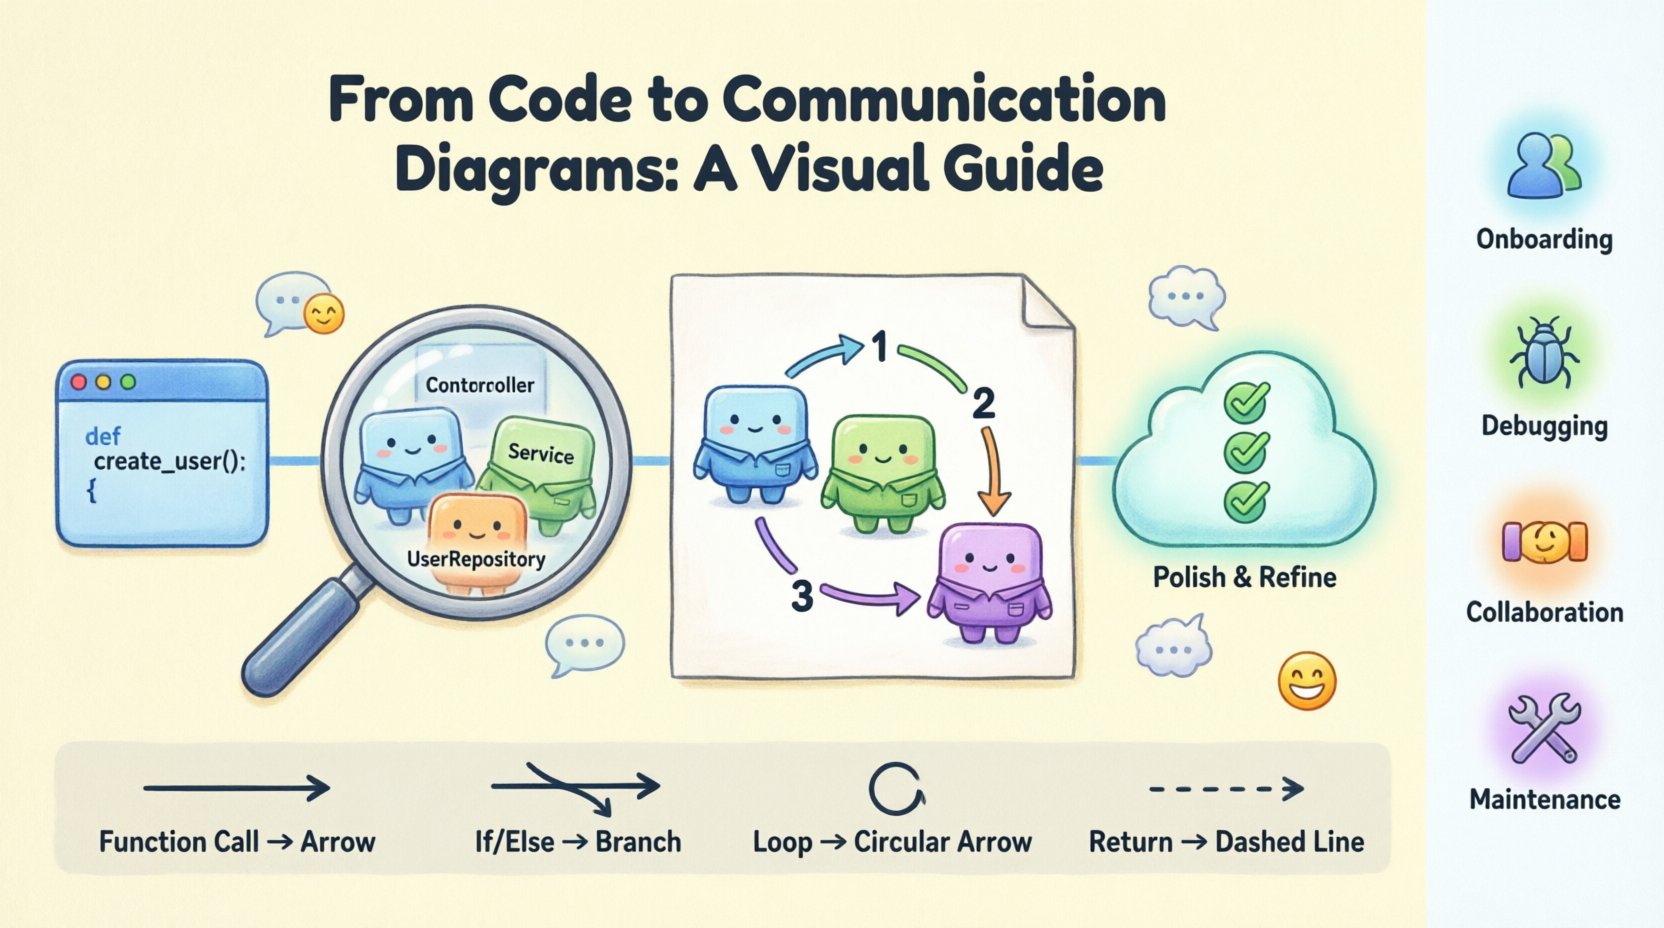
- Onboarding: New team members can grasp system architecture faster with visuals than with raw codebases.
- Debugging: Visualizing the path of data helps isolate where logic breaks or where unexpected states occur.
- Collaboration: Architects, product managers, and developers share a common language when diagrams are used.
- Maintenance: Documentation that matches the code structure reduces technical debt over time.
What Defines a Communication Diagram? 📊
Before translating logic, it is essential to understand the specific notation used. Unlike sequence diagrams which prioritize time order vertically, communication diagrams emphasize the spatial relationship between objects. They represent the interactions through links and messages.
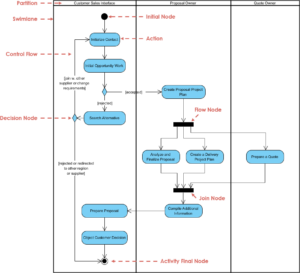
Key elements include:
- Objects: Representations of classes or instances within the system.
- Links: Lines connecting objects, showing that they can interact.
- Messages: Arrows indicating a call or data transfer between objects.
- Sequence Numbers: Numbers attached to messages to show the order of execution.
This structure allows you to see the topology of the interaction. It answers the question: “Which object talks to which other object, and in what sequence?”
Preparation: Analyzing the Code Logic 🔍
Turning code into a diagram requires a deep understanding of the underlying logic. You cannot simply visualize functions; you must understand the state changes and dependencies. The following steps outline how to prepare your codebase for this process.
1. Identify the Actors and Objects
Start by reviewing the classes involved in the feature you are documenting. Look for the primary entry point and the downstream consumers.
- Identify the Controller or Service classes that initiate the flow.
- Identify the Repository or Data classes that handle persistence.
- Identify any external API Clients or third-party services involved.
2. Trace the Execution Flow
Trace a specific scenario through the code. Follow the execution from the public interface down to the database or external call. This trace forms the backbone of your diagram.
- Map out the function calls.
- Note any conditional branches (if/else).
- Identify loops or iterative processes.
- Record error handling paths.
3. Determine the Data Payload
A diagram is not just about control flow; it is about data flow. What information is passed between objects?
- Is it a request object?
- Is it a simple ID?
- Is it a callback function or a promise?
The Translation Process: From Code to Diagram 🛠️
Once the logic is analyzed, the actual translation begins. This section details the step-by-step construction of the diagram.
Step 1: Place the Objects
Begin by placing the identified objects on the canvas. Avoid cluttering the view. Group related objects together visually.
- Use distinct shapes or icons for different types of objects (e.g., User Interface, Business Logic, Data Storage).
- Ensure labels are clear and match the code naming conventions (e.g.,
UserRepositoryinstead ofRepo1). - Place the initiating object at the top or left, depending on the reading direction of your team.
Step 2: Draw the Links
Draw lines between objects that interact. A link represents a static relationship. If Object A knows how to contact Object B, draw a line.
- Do not draw lines for every possible interaction, only for those that occur in the specific scenario.
- Keep lines straight where possible to reduce visual noise.
- Use different line styles to distinguish between different types of relationships (e.g., strong dependency vs. weak association).
Step 3: Add the Messages
This is the core of the diagram. Messages represent the method calls or data transfers.
- Draw arrows from the sender to the receiver.
- Label the arrow with the method name or action (e.g.,
fetchUser()orupdateStatus()). - Number the messages sequentially (1, 2, 3…) to indicate the order of execution.
Step 4: Handle Conditional Logic
Real-world code rarely follows a straight line. You must represent branches and loops.
- If/Else: Split the flow into parallel paths. Label the arrows with the condition (e.g.,
[isValid]or[!isValid]). - Loops: Indicate iterations clearly. You might label a message with a loop count or a condition like
[while more data]. - Error Handling: Draw arrows pointing to error handling objects or return paths that indicate failure states.
Mapping Code Constructs to Diagram Elements 📝
To ensure consistency, it helps to have a reference guide that maps common programming constructs to diagram symbols.
| Code Construct | Diagram Representation | Example |
|---|---|---|
| Function Call | Arrow with Method Name | user.save() → Arrow labeled save() |
| Variable Assignment | Arrow with Data Label | Data passed to next object labeled userData |
| Condition (If) | Guarded Path | Arrow labeled [user exists] |
| Loop (For/While) | Iterative Arrow | Arrow labeled [repeat for each item] |
| Return Value | Dashed Arrow | Dashed line pointing back with return result |
| Exception/Throw | Error Path | Arrow pointing to Error Handler labeled throw Error |
Refining the Diagram for Clarity ✨
A diagram that is technically accurate but confusing is useless. Refinement is the stage where you optimize the visual layout for human consumption.
Naming Conventions
Consistency is key. Ensure that every label follows a standard.
- Use PascalCase for Classes/Objects.
- Use camelCase for Methods/Functions.
- Use lowercase for primitive data types where appropriate.
Minimizing Crossings
Arrow crossings create cognitive load. Re-arrange objects on the canvas to minimize the number of times lines intersect.
- Group related objects tightly together.
- Use orthogonal routing (right-angle lines) instead of diagonal lines if the tool allows.
- Consider using sub-diagrams for complex interactions.
Annotation Strategy
Do not overcrowd the diagram. Use notes or annotations for context that does not fit in the flow.
- Add notes about performance constraints (e.g.,
[Timeout: 5s]). - Highlight security requirements (e.g.,
[HTTPS Only]). - Clarify business rules that are not obvious from the code alone.
Handling Complex Scenarios 🧩
Not all code logic fits into a single diagram. Large systems require breaking down logic into manageable chunks.
1. Modularization
Break the diagram by feature or module. Instead of one giant diagram for the whole application, create separate diagrams for:
- Authentication Flow
- Data Processing Pipeline
- Notification Service
2. Hierarchical Diagrams
Use high-level diagrams for architecture and detailed diagrams for specific functions.
- Level 1: System boundary and external actors.
- Level 2: Internal component interactions.
- Level 3: Detailed object collaboration within a class.
3. Asynchronous Interactions
Modern systems often rely on asynchronous messaging. Representing these requires specific notations.
- Use signal messages (open arrowheads) for fire-and-forget events.
- Indicate callbacks explicitly to show where the response occurs.
- Label the queue or broker if a message bus is involved.
Maintaining Synchronization with Code 🔄
One of the biggest challenges in software documentation is keeping diagrams in sync with code. As the code evolves, the diagram must evolve with it.
1. Treat Diagrams as Code
Store your diagram definitions in the same version control system as your source code. This ensures that diagrams are reviewed in pull requests alongside the code changes.
2. Update Triggers
Define rules for when a diagram must be updated.
- Any change in the public API of a class.
- Addition of a new dependency.
- Refactoring of a major business logic flow.
3. Automated Generation
Where possible, use tools that can generate diagrams from code metadata. This reduces the manual effort required to keep documentation current.
- Extract class relationships automatically.
- Generate skeleton diagrams that developers fill in.
- Use static analysis to highlight discrepancies between code and docs.
Common Pitfalls to Avoid ⚠️
Even experienced practitioners make mistakes when creating communication diagrams. Be aware of these common issues.
- Over-Abstraction: Leaving out too much detail makes the diagram useless for developers. Include enough method names to be actionable.
- Under-Abstraction: Including every single line of code creates a mess. Focus on the high-level interaction flow.
- Ignoring State: Failing to show state changes can lead to confusion about when data is available.
- Missing Return Paths: Showing the request but not the response makes the flow feel incomplete.
- Inconsistent Notation: Mixing sequence numbers with timing constraints can confuse the reader about what is being measured.
Conclusion on Visual Documentation 🏁
Translating code logic into communication diagrams is a skill that bridges the gap between technical implementation and architectural understanding. It requires discipline to analyze the code deeply and the creativity to represent it visually without losing accuracy. By following a structured approach, identifying objects clearly, and maintaining synchronization with the codebase, teams can create documentation that truly serves the development lifecycle.
The effort invested in these diagrams pays dividends in reduced onboarding time, fewer bugs, and clearer communication across departments. As systems grow in complexity, the ability to visualize logic becomes not just a nice-to-have, but a fundamental requirement for sustainable software engineering.
Start with a small module. Apply these steps. Iterate on the design. Over time, the habit of visualizing logic will become a natural part of your development process.