Understanding how software components talk to one another is fundamental to building robust systems. 🏗️ While many focus on code logic, the visual representation of interactions often holds the key to clarity. Communication diagrams provide a structured way to map these exchanges. They focus on the relationships between objects and the messages they send. This guide explores how to utilize this notation effectively for system architecture.
🧩 What Are Communication Diagrams?
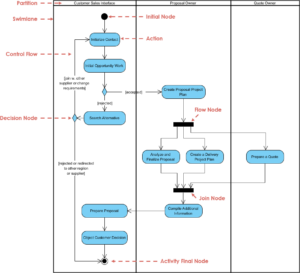
A communication diagram, formerly known as a collaboration diagram, is a type of Unified Modeling Language (UML) diagram. It illustrates the interactions between objects or parts within a system. Unlike other flowcharts that focus heavily on time sequences, this diagram emphasizes the structural organization of the participants. It shows how objects are linked and how they pass information along those links.
Think of it as a map of conversation. Each object is a node, and each connection is a line of communication. The flow of control is indicated by numbered arrows. This approach helps developers visualize the physical or logical topology of the interaction flow. It answers the question: Who talks to whom, and in what order?
📐 Anatomy of a Communication Diagram
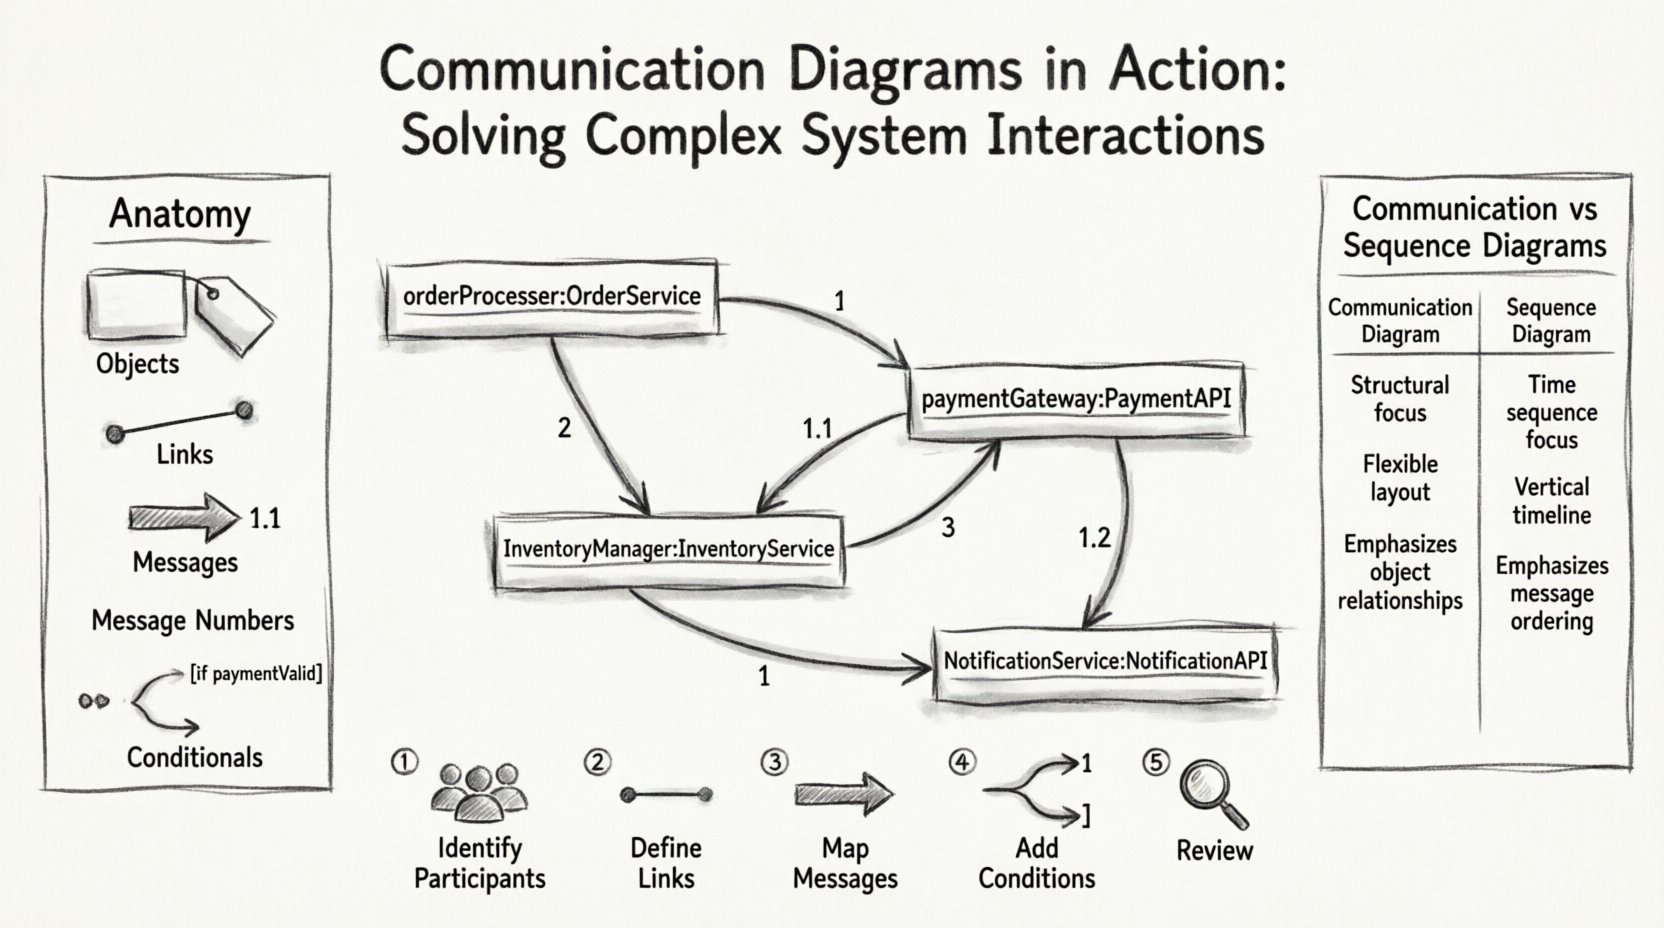
To build an accurate diagram, one must understand its core components. Each element serves a specific purpose in defining the system behavior. Here are the fundamental building blocks:
- Objects: Represent instances of classes participating in the interaction. They are depicted as rectangles with the object name underlined.
- Links: These represent the associations between objects. They show that an object can reach another object directly. Links can be named to specify the role the object plays in the association.
- Messages: These are the interactions sent from one object to another. They are drawn as arrows connecting the objects.
- Message Numbers: To show the sequence, messages are numbered (1, 2, 3). Nested messages use decimal notation (1.1, 1.2).
- Conditionals: Branching paths can be shown using guards. These are conditions written in brackets that determine if a message is sent.
By defining these elements clearly, you create a blueprint that is easier to debug and maintain. The visual layout helps stakeholders see the complexity without reading thousands of lines of code. 📊
⚖️ Sequence vs. Communication Diagrams
There is often confusion between communication diagrams and sequence diagrams. Both depict interactions, but they highlight different aspects of the system. A comparison table clarifies the distinctions:
| Feature | Communication Diagram | Sequence Diagram |
|---|---|---|
| Focus | Structural relationships between objects | Time-ordered sequence of messages |
| Layout | Flexible, spatial arrangement | Vertical timeline (time flows down) |
| Readability | Better for complex, multi-object scenarios | Better for linear, step-by-step processes |
| Message Flow | Shown via numbered arrows | Shown via vertical placement on lifelines |
| Complexity | Can show many-to-many relationships easily | Can become cluttered with many parallel threads |
Choosing the right tool depends on the audience and the specific problem. If the team needs to understand the network of dependencies, a communication diagram is often superior. If the focus is on the timing and order of events, a sequence diagram might be preferred.
🛠️ Creating a Communication Diagram: Step-by-Step
Creating these diagrams requires a methodical approach. Follow these steps to ensure accuracy and clarity.
1. Identify the Participants
Start by listing the objects involved in the specific scenario. Do not include every class in the system. Focus only on those relevant to the interaction you are documenting. This keeps the diagram manageable and relevant. ✍️
2. Define the Links
Draw lines between the objects that have a direct association. If Object A needs to call a method on Object B, a link must exist. Ensure the link is named if the association has a specific role. This clarifies the nature of the relationship.
3. Map the Messages
Draw arrows to represent the flow of information. Start with the initiator. Use numbers to indicate the order of operations. For example, the first message is “1”, the second is “2”. If a message triggers a sub-process, label it “1.1”. This nesting shows hierarchy without cluttering the timeline.
4. Add Conditions and Loops
Systems are rarely linear. Add guards to show conditional logic. Use brackets like [if valid]. For loops, specify the repetition count or condition, such as *[while active]. This captures the dynamic behavior of the software.
5. Review and Refine
Once drafted, review the diagram with the development team. Check for orphaned objects (nodes with no connections) or broken chains. Ensure the numbering is logical. A confusing diagram is worse than no diagram at all. 🔄
🚀 Advanced Patterns for Complex Interactions
Simple scenarios are easy to model. Real-world systems often involve recursion, parallelism, and complex routing. Here is how to handle those advanced cases.
Recursion and Self-Calls
Sometimes an object needs to call a method on itself. This is represented by an arrow that starts and ends on the same object. Label the message number appropriately, such as “1” for the entry and “1.1” for the recursive step. This helps in understanding stack depth and potential infinite loops.
Multiple Instances
A single class might be instantiated multiple times. You can represent this by showing multiple rectangles with the same class name but different instance names (e.g., user:User and user:User). This is crucial for modeling scenarios where a controller manages a collection of items.
Asynchronous Messaging
Not all messages wait for a reply. Asynchronous calls are common in event-driven architectures. Use a specific arrow style or label the message to indicate it does not block the sender. This distinction is vital for performance analysis.
Fragmented Flows
Use fragments to group sections of the diagram. This allows you to isolate specific behaviors, such as error handling or alternative paths, without drawing separate diagrams for every edge case. It maintains the overview while allowing detail where needed.
📉 Common Pitfalls and How to Avoid Them
Even experienced architects make mistakes when modeling interactions. Being aware of common errors can save significant time during the implementation phase.
- Overcrowding: Trying to fit every possible interaction into one diagram makes it unreadable. Split complex processes into smaller, focused diagrams. It is better to have three clear diagrams than one messy one.
- Ignoring Links: Forgetting to draw the links between objects implies they cannot talk. Always ensure a link exists before drawing a message arrow.
- Vague Naming: Use specific names for methods and objects. “ProcessData” is better than “DoSomething”. Context matters. 🧐
- Missing Return Messages: While not always required, showing return messages can clarify data flow. Decide on a standard for your team regarding whether to include return arrows.
- Ignoring State: Communication diagrams do not show state changes well. If state is critical, supplement this diagram with a state diagram or ensure the object name reflects its current state.
🤝 Collaboration with Stakeholders
These diagrams are not just for developers. They serve as a communication bridge between technical and non-technical stakeholders. When presenting these models, focus on the business value.
Explain how the flow of messages ensures data integrity. Show how the links represent the stability of the system architecture. Use the diagram to identify bottlenecks. If a single object is receiving messages from ten others, it might be a point of failure. 🛡️
🔄 Maintenance and Documentation
Software evolves. Requirements change. A diagram that was accurate last month might be obsolete today. Treat these diagrams as living documents.
- Version Control: Store diagrams alongside the code. This ensures that the visual model matches the current codebase.
- Regular Audits: Schedule reviews of the diagrams during sprint planning. If the code changes, the diagram must change.
- Onboarding: Use these diagrams to train new team members. They provide a high-level view of the system that code alone cannot offer.
🎯 Best Practices for Clarity
Adhering to a set of standards improves the utility of the diagrams across the organization.
- Consistent Orientation: Try to keep the layout consistent across the project. If left-to-right is the standard for data flow, maintain it.
- Limit Depth: Avoid nesting messages deeper than three levels (e.g., 1.1.1). If you need more, consider a separate sub-diagram.
- Color Usage: Use color sparingly. Highlight critical paths or error states, but do not use color as the only indicator of meaning.
- Legend: If using non-standard notation, include a legend. This ensures anyone can read the diagram without prior specific training.
💡 Conclusion on System Interaction Modeling
Communication diagrams offer a powerful lens for viewing system complexity. They translate abstract code into a visual narrative that is easier to analyze. By focusing on the structural relationships and the flow of messages, teams can identify issues before they become bugs. 🛠️
The effort invested in creating these diagrams pays dividends in maintenance and understanding. They serve as a reference point for future development and a tool for architectural review. As systems grow in size and complexity, the ability to visualize interactions becomes an essential skill for any technical professional.
Start by applying these principles to your current projects. Document the critical paths. Refine the notation. Over time, the clarity you bring to the architecture will improve the quality of the software delivered. Keep the focus on clarity, structure, and accurate representation of the system’s behavior.
🔍 Frequently Asked Questions
Q: Can I use this for microservices architecture?
A: Yes. While often used for object-oriented systems, the principles apply to distributed services. Represent services as objects and network calls as messages.
Q: Do I need to draw every single message?
A: No. Focus on the critical flow. Omit trivial getters or internal operations unless they are relevant to the specific scenario being modeled.
Q: How do I handle errors?
A: Use conditional guards to show paths taken when an error occurs. You can also draw a separate path for exception handling to keep the main flow clean.
Q: Is this diagram suitable for database interactions?
A: It can be. Treat the database as an object. Show the queries as messages. However, for complex query logic, a sequence diagram or specific SQL schema diagram might be more appropriate.