Entering the world of software development often means navigating a sea of technical documentation. Among the most common visual languages you will encounter is the Unified Modeling Language, commonly known as UML. For a junior developer, understanding these diagrams is not just about drawing shapes; it is about deciphering the architecture and behavior of a system before writing a single line of code. This guide breaks down the essential elements of UML, helping you read and interpret diagrams with confidence.
What Is Unified Modeling Language? 🧩
UML is a standardized modeling language used in software engineering. It provides a set of graphical notation techniques to create visual models of software systems. Think of it as the blueprint for a building. Before an architect builds a house, they draw plans showing where walls, doors, and windows go. In software, UML serves the same purpose, outlining classes, objects, interactions, and data flow.
Why is this important? Because software systems are complex. They involve multiple developers working on different parts of the same application. A shared visual language ensures everyone understands the system design in the same way. Without it, communication breaks down, leading to bugs and architectural inconsistencies.
Categorizing UML Diagrams 📂
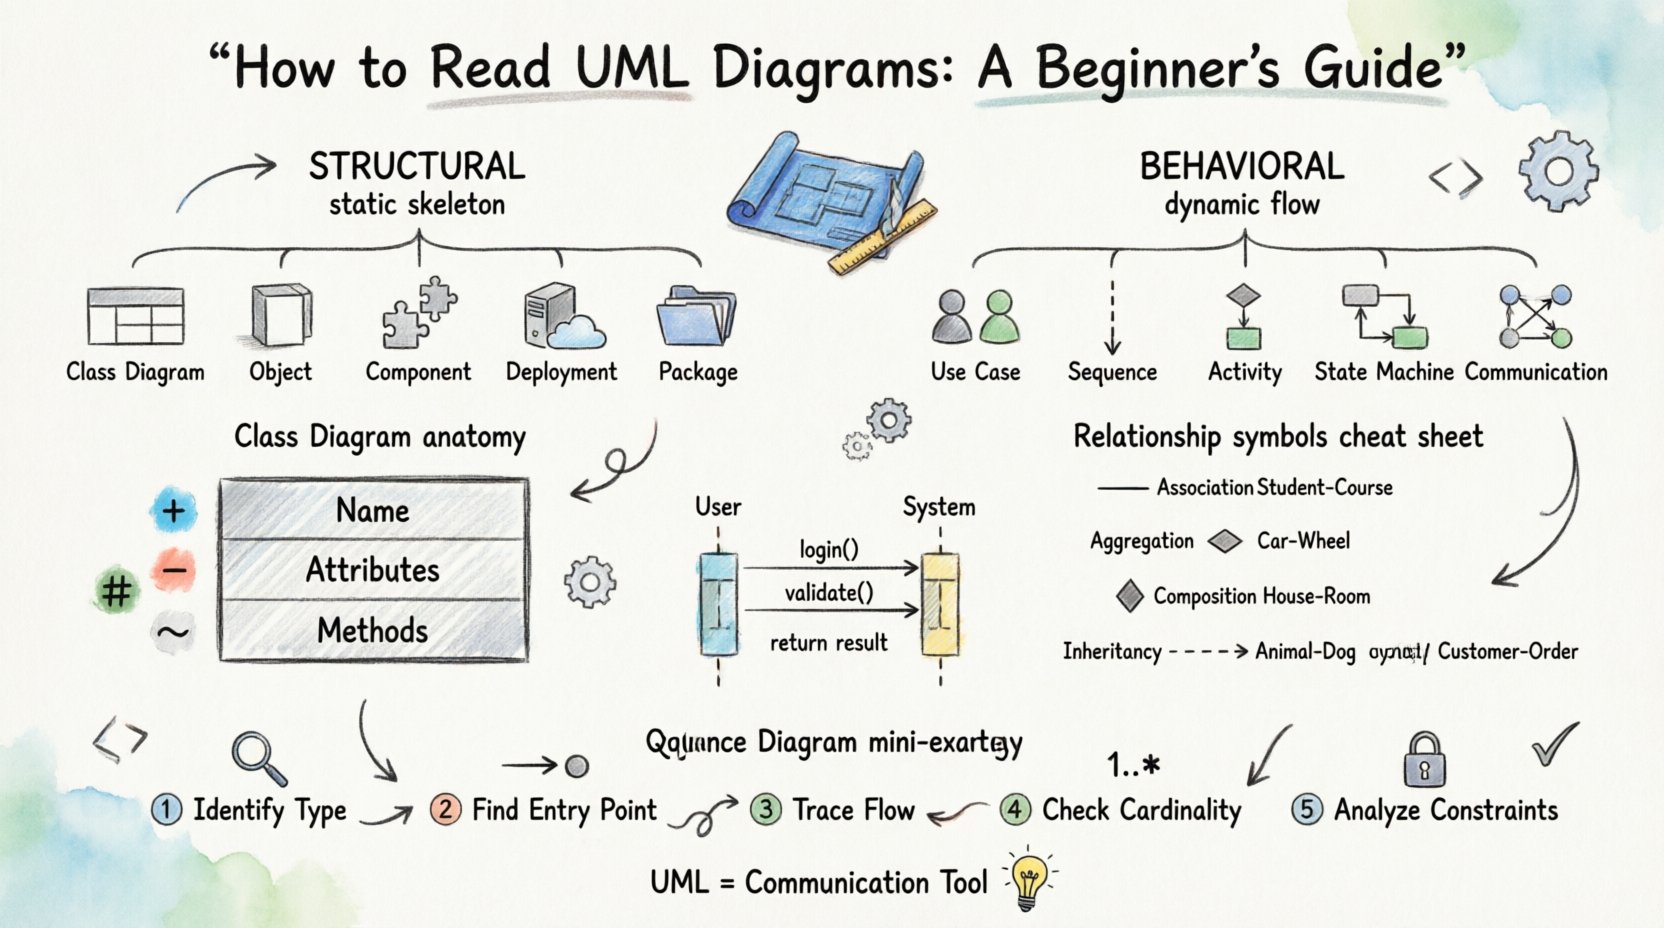
To understand how to read UML effectively, you must first understand how the diagrams are grouped. The standard divides UML into two main categories: Structural and Behavioral. Structural diagrams describe the static aspects of a system, while behavioral diagrams describe the dynamic aspects.
It is crucial to distinguish between these types. When you pick up a diagram, ask yourself: Is this showing the structure of the data and components, or is it showing how the system acts over time?
Structural Diagrams 🏗️
Structural diagrams define the static structure of the system. They are like the skeleton of the software.
- Class Diagram: The most common diagram type. It shows classes, their attributes, operations (methods), and the relationships between objects.
- Object Diagram: A snapshot of instances of classes at a specific point in time. It is essentially a specific instance of a class diagram.
- Component Diagram: Shows the organization and dependencies between high-level components or modules.
- Deployment Diagram: Represents the physical hardware and software architecture, showing where components are deployed.
- Package Diagram: Groups elements into packages to manage complexity and show dependencies between groups.
Behavioral Diagrams ⚙️
Behavioral diagrams describe the dynamic behavior of the system. They show how things change and interact.
- Use Case Diagram: Illustrates the interactions between actors (users or external systems) and the system itself to achieve a goal.
- Sequence Diagram: Shows how objects interact with each other over time. It is a time-ordered list of messages exchanged between objects.
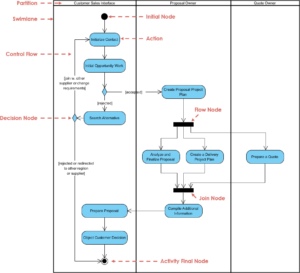
- Activity Diagram: Similar to a flowchart, it models the flow of control from activity to activity.
- State Machine Diagram: Describes how an object behaves in response to internal and external events.
- Communication Diagram: Focuses on the organization of objects and their links, similar to a sequence diagram but emphasizing the structural relationship.
- Interaction Overview Diagram: Combines activity and sequence diagrams to show high-level control flow and interaction.
Deep Dive into Class Diagrams 🏛️
For a junior developer, the Class Diagram is the most critical tool to master. It is the backbone of object-oriented design. When reading one, you are looking at the building blocks of your application.
The Anatomy of a Class Box
A class is typically represented as a rectangle divided into three compartments:
- Name: The top section contains the name of the class (e.g.,
CustomerorOrder). - Attributes: The middle section lists the properties or data members (e.g.,
customerName,emailAddress). - Methods: The bottom section lists the operations or functions available to the class (e.g.,
placeOrder(),login()).
Visibility is indicated by symbols before the attribute or method name:
- + Public: Accessible from anywhere.
- – Private: Accessible only within the class itself.
- # Protected: Accessible within the class and its subclasses.
- ~ Package: Accessible within the same package.
Understanding Relationships
The lines connecting classes tell the story of how they relate. These lines have arrows and symbols that carry specific meanings.
| Relationship Type | Symbol Description | Meaning |
|---|---|---|
| Association | Solid line | A structural relationship where objects are linked. |
| Aggregation | Open diamond on one end | A „whole-part” relationship where the part can exist without the whole. |
| Composition | Filled diamond on one end | A strong „whole-part” relationship where the part cannot exist without the whole. |
| Inheritance (Generalization) | Triangle arrow pointing to parent | One class is a specialized version of another. |
| Dependency | Dashed arrow | One class uses another, but does not own it. |
Reading Sequence Diagrams 📅
Once you understand static structure, you need to understand dynamic flow. Sequence diagrams are essential for understanding how data moves through the system during a specific operation.
When you look at a sequence diagram, you will see vertical lines called lifelines. These represent objects or actors. Horizontal arrows between these lines represent messages being sent. The direction of the arrow indicates the sender and receiver.
Key Elements to Spot
- Activation Bar: A thin rectangle on the lifeline. It indicates the period during which an object is performing an action.
- Return Message: A dashed arrow returning to the sender, often used to indicate the completion of a request or a returned value.
- Self-Message: An arrow that loops back to the same lifeline, indicating an internal operation.
- Frame Boxes: Large boxes surrounding parts of the diagram labeled with keywords like alt (alternative), opt (optional), or loop (iteration).
For example, if you see a loop frame, it means a set of interactions happens repeatedly. If you see an alt frame, it means the behavior depends on a condition (like an if/else statement in code).
Notation and Symbols Cheat Sheet 📝
UML relies on specific symbols to convey meaning without words. Memorizing these will speed up your reading process significantly.
| Symbol | Usage | Example Context |
|---|---|---|
| Open Arrowhead | Dependency | Class A uses Class B. |
| Filled Arrowhead | Realization/Implementation | An interface is implemented by a class. |
| Open Diamond | Aggregation | A Car has a Wheel (Wheel can exist alone). |
| Filled Diamond | Composition | A Human has a Heart (Heart cannot exist alone). |
| Arrow with Triangle | Generalization | Invoice extends Bill. |
| Dashed Line | Dependency | Temporary usage of a resource. |
| Rectangle with Tabs | Interface | A contract defining methods. |
Step-by-Step Strategy for Reading Diagrams 🧭
Do not try to read every single symbol at once. Use a systematic approach to avoid getting overwhelmed.
- Identify the Type: Determine if you are looking at structure (Class, Component) or behavior (Sequence, Use Case). This sets the context.
- Find the Entry Point: In sequence diagrams, look for the actor initiating the interaction. In class diagrams, look for the main entity you are interested in.
- Trace the Flow: Follow the arrows. In behavioral diagrams, trace the messages from top to bottom. In structural diagrams, trace relationships from left to right.
- Check Cardinality: Look for numbers near the ends of lines (e.g., 1, 0..1, *). These define how many instances can be related (e.g., One Customer places Many Orders).
- Analyze Constraints: Look for text in curly braces
{ }. These often contain conditions, such as{unique}or{abstract}.
Common Pitfalls for Beginners 🚫
Even experienced developers can misinterpret diagrams if they rush. Here are common mistakes to avoid.
- Confusing Aggregation and Composition: This is the most frequent error. Remember: if the part dies when the whole dies, it is composition. If the part can survive independently, it is aggregation.
- Ignoring Cardinality: Lines often have numbers like
1or0..*. Ignoring these can lead to understanding that a relationship is one-to-one when it is actually one-to-many. - Overlooking Visibility: A private method in a class diagram means it cannot be called by external objects. Missing this sign can lead to incorrect assumptions about access control.
- Mixing Levels of Abstraction: A diagram should usually stay at one level. Do not mix high-level business processes with low-level database schema details in the same view.
- Assuming Code Existence: A diagram represents a design. Just because a relationship is drawn does not mean the code is written yet. UML is a model, not the implementation itself.
Integrating UML into Your Workflow 🛠️
Reading diagrams is only half the battle. Applying this knowledge to your daily tasks improves your development efficiency.
Before You Code
When given a new feature, ask for or create a sequence diagram to map out the data flow. This helps identify edge cases before implementation. It also reveals dependencies on other services or modules that you might not have noticed.
During Code Review
If a colleague submits code that does not match the design, refer back to the UML. It serves as the source of truth for the intended architecture. Use the class diagram to verify if the new classes follow the established relationships and naming conventions.
When Debugging
If a system behaves unexpectedly, trace the execution path on a sequence diagram. Compare the actual execution logs with the expected message flow. This often isolates where the logic deviates from the design.
The Value of UML in Modern Development ⚡
Some teams argue that UML is too heavy for agile development. However, lightweight UML is a powerful asset. It reduces the cognitive load when onboarding new team members. A new developer can look at a well-documented class diagram to understand the domain model in minutes rather than weeks of code exploration.
It also aids in system documentation. Code comments explain *how* something works, but UML explains *what* the system is and *how* the parts fit together. This distinction is vital for maintaining large-scale applications over years.
Practical Exercises to Improve 📚
There is no substitute for practice. Here are ways to build your skills.
- Reverse Engineer: Take a simple open-source project and try to draw a class diagram for its core module based on the code.
- Sketch Daily: Spend five minutes a day sketching a simple activity diagram for a routine task (e.g., making coffee, logging in).
- Review Documentation: Look at API documentation that includes diagrams. Try to understand the interaction flow without reading the text.
- Compare Versions: If you have access to older and newer diagrams of a project, compare them to see how the architecture evolved.
Wrapping Up Your Journey 🎓
Learning to read UML diagrams is a skill that grows with experience. It transforms abstract code into a tangible structure. As you become more comfortable with the symbols and relationships, you will find that these diagrams are not obstacles, but maps that guide you through complex systems.
Start small. Focus on Class and Sequence diagrams first, as they cover the majority of use cases. Gradually expand to other types as your understanding of the system deepens. With consistent practice, you will move from simply recognizing shapes to understanding the underlying logic of the software architecture.
Remember, the goal is communication. Whether you are drawing for others or reading someone else’s work, clarity is the priority. Use the standard symbols correctly, keep the diagrams clean, and ensure they match the code. This alignment is the hallmark of a professional developer.
Keep your diagrams up to date. Outdated diagrams are more confusing than no diagrams at all. Treat them as living documents that evolve alongside the codebase. By mastering this language, you equip yourself with a universal tool that bridges the gap between design and implementation.