Tag: academic
The Hidden Benefits of Using Communication Diagrams in Team Software Development

In the complex ecosystem of modern software engineering, information often gets lost in translation between requirements, code, and design. Developers frequently rely on text-based specifications, which can lead to misinterpretation of complex system behaviors. While text has its place, visual …
Communication Diagrams Simplified: A No-Jargon Overview for Beginners

Understanding how different parts of a system interact is fundamental to building robust software. One of the most effective ways to visualize these interactions is through a communication diagram. This guide breaks down the concept without the heavy jargon often …
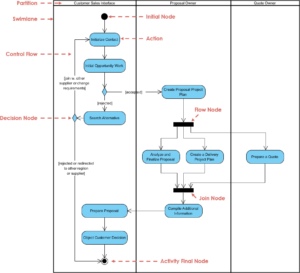
10 Common Mistakes When Drawing Activity Diagrams and How to Fix Them

Activity diagrams are a fundamental component of Unified Modeling Language (UML) used to visualize the flow of control within a system. They represent the dynamic aspects of a system, showing how actions occur from start to finish. However, creating accurate …
Checklist: How to Create Error-Free Communication Diagrams on Your First Try

System architecture relies heavily on clear documentation. When teams discuss how software components interact, ambiguity can lead to bugs, delays, and misaligned expectations. A communication diagram serves as a vital tool in this process. It visualizes how objects interact within …
Breaking Down Communication Diagrams: A Component Analysis for IS Students

Information Systems (IS) students frequently encounter the challenge of translating abstract requirements into concrete structural models. Among the various Unified Modeling Language (UML) artifacts, the communication diagram stands out as a critical tool for visualizing object interactions. Unlike static structure …
Activity Diagram Checklist: 15 Points to Ensure Your Diagram is Standard-Compliant

Activity diagrams are a cornerstone of system modeling and software engineering. They provide a visual representation of the dynamic aspects of a system, illustrating the flow of control and data from one activity to another. When creating these diagrams, adherence …
Communication Diagrams vs Sequence Diagrams: Which One Should You Use for Your Projects?

In the landscape of software architecture, clarity is currency. When designing complex systems, the choice of visualization tool determines how effectively a team understands the flow of logic and data. Two of the most prominent artifacts in the Unified Modeling …
Step-by-Step: Turning Code Logic into Clear Communication Diagrams

Developers spend countless hours writing code, yet the true complexity of a system often lies hidden within layers of functions and methods. When teams need to understand how components interact, text-based documentation often falls short. This is where visual representation …
Activity Diagram Troubleshooting: What to Do When Your State Logic Gets Stuck

When designing complex systems, activity diagrams serve as the backbone for visualizing workflows and control flows. However, even the most meticulously crafted diagrams can encounter logical bottlenecks. You might find yourself staring at a process that never reaches its final …
Quick Start to Communication Diagrams: Draw Your First Diagram in Minutes

Visualizing how software components interact is a critical skill for system architects and developers. Communication diagrams offer a unique perspective on object interactions, focusing on the relationships and message flow between system elements. Unlike other modeling techniques that prioritize time, …