In systems analysis, bridging the gap between business requirements and technical implementation is a critical challenge. Often, this gap exists because the language of the business differs significantly from the language of development. Business stakeholders speak in processes, goals, and outcomes. Developers speak in logic, data structures, and execution flows. Activity diagrams serve as the universal translator in this scenario. They provide a visual representation of workflows that does not require coding knowledge to interpret. This guide explores how to create and utilize activity diagrams effectively without relying on technical jargon or proprietary tools.
What is an Activity Diagram? 🔍
An activity diagram is a behavioral diagram that shows the flow of control from activity to activity. While flowcharts are similar, activity diagrams go a step further by modeling parallel flows and interactions between different actors or systems. For non-coders, this visual format is invaluable. It allows stakeholders to see the entire lifecycle of a process, from start to finish, without needing to read a technical specification document.
Think of an activity diagram as a map of a journey. It does not tell you how the vehicle is built (the code), but it tells you the route, the stops, the decision points, and the final destination. This clarity is essential for systems analysis teams who need to validate that a proposed system meets business needs.
Why Non-Coders Should Use Activity Diagrams 🚀
There are several compelling reasons for business analysts, product owners, and process managers to engage with activity diagrams directly:
- Clarity in Complex Processes: Text-based requirements often fail to capture the nuance of conditional logic. A diagram makes “if this, then that” scenarios immediately visible.
- Early Error Detection: Logic errors are easier to spot visually before a single line of code is written. Missing branches or infinite loops become obvious on a whiteboard.
- Shared Understanding: A diagram is a single source of truth. It prevents the “telephone game” where requirements get distorted as they pass from business to development to testing.
- Efficient Communication: Meetings become more productive when everyone is looking at the same visual flow rather than a dense document.
Core Components and Symbols 📝
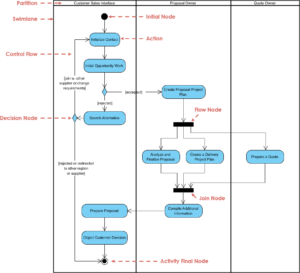
Before creating a diagram, it is necessary to understand the standard symbols used. These symbols are universally recognized in modeling standards, ensuring that anyone on the team can read the output.
| Symbol | Shape | Meaning |
|---|---|---|
| Start Node | Filled Circle | Indicates the beginning of the process. |
| End Node | Double Circle | Indicates the successful termination of the process. |
| Activity / Action | Rounded Rectangle | A specific task or step that consumes time. |
| Decision | Diamond | A point where the flow branches based on a condition. |
| Control Flow | Arrow | Shows the direction of the process movement. |
| Fork / Join | Thick Bar | Splits the flow into parallel activities or merges them back. |
| Object Flow | Thin Line with Arrow | Shows data or objects moving between activities. |
Building Your First Diagram: A Step-by-Step Approach 🛠️
Creating an activity diagram is a structured process. You do not need to be a designer to do this well. Follow these logical steps to ensure your diagrams are accurate and useful.
1. Define the Scope and Boundary
Every diagram must have a clear start and end. Ask yourself: What triggers this process? What is the desired outcome? For example, if you are modeling a “Loan Approval” process, the start is the submission of the application, and the end is either the funding of the loan or the rejection notification.
2. Identify the Actors
Who is involved in this process? In systems analysis, we often use swimlanes to separate responsibilities. A swimlane is a vertical or horizontal container that groups activities by the actor responsible for them. This helps prevent ambiguity about who does what.
Common actors include:
- Customer / User
- Business Analyst
- System / Application
- Administrator
- External Service
3. Map the Primary Flow
Start by drawing the ideal path. This is the “Happy Path” where everything goes according to plan. Map out the sequential steps from the Start Node to the End Node. Do not worry about errors or exceptions yet. Focus on the core logic.
4. Add Decision Points
Once the primary flow is established, identify where choices must be made. Draw a diamond shape at these points. Label the outgoing arrows with the condition (e.g., “Yes”, “No”, “Approved”, “Declined”). Ensure that all possible paths from a decision point are accounted for.
5. Incorporate Parallel Activities
Not all processes are linear. Sometimes multiple tasks happen at the same time. Use a thick bar (Fork) to split the flow into parallel lanes. Use another thick bar (Join) to wait for all parallel paths to complete before continuing. This is crucial for understanding system concurrency.
6. Review and Refine
Walk through the diagram with a fresh pair of eyes. Does every arrow have a destination? Are all paths eventually reaching an end node? Is the logic sound? This review stage is where most errors are caught.
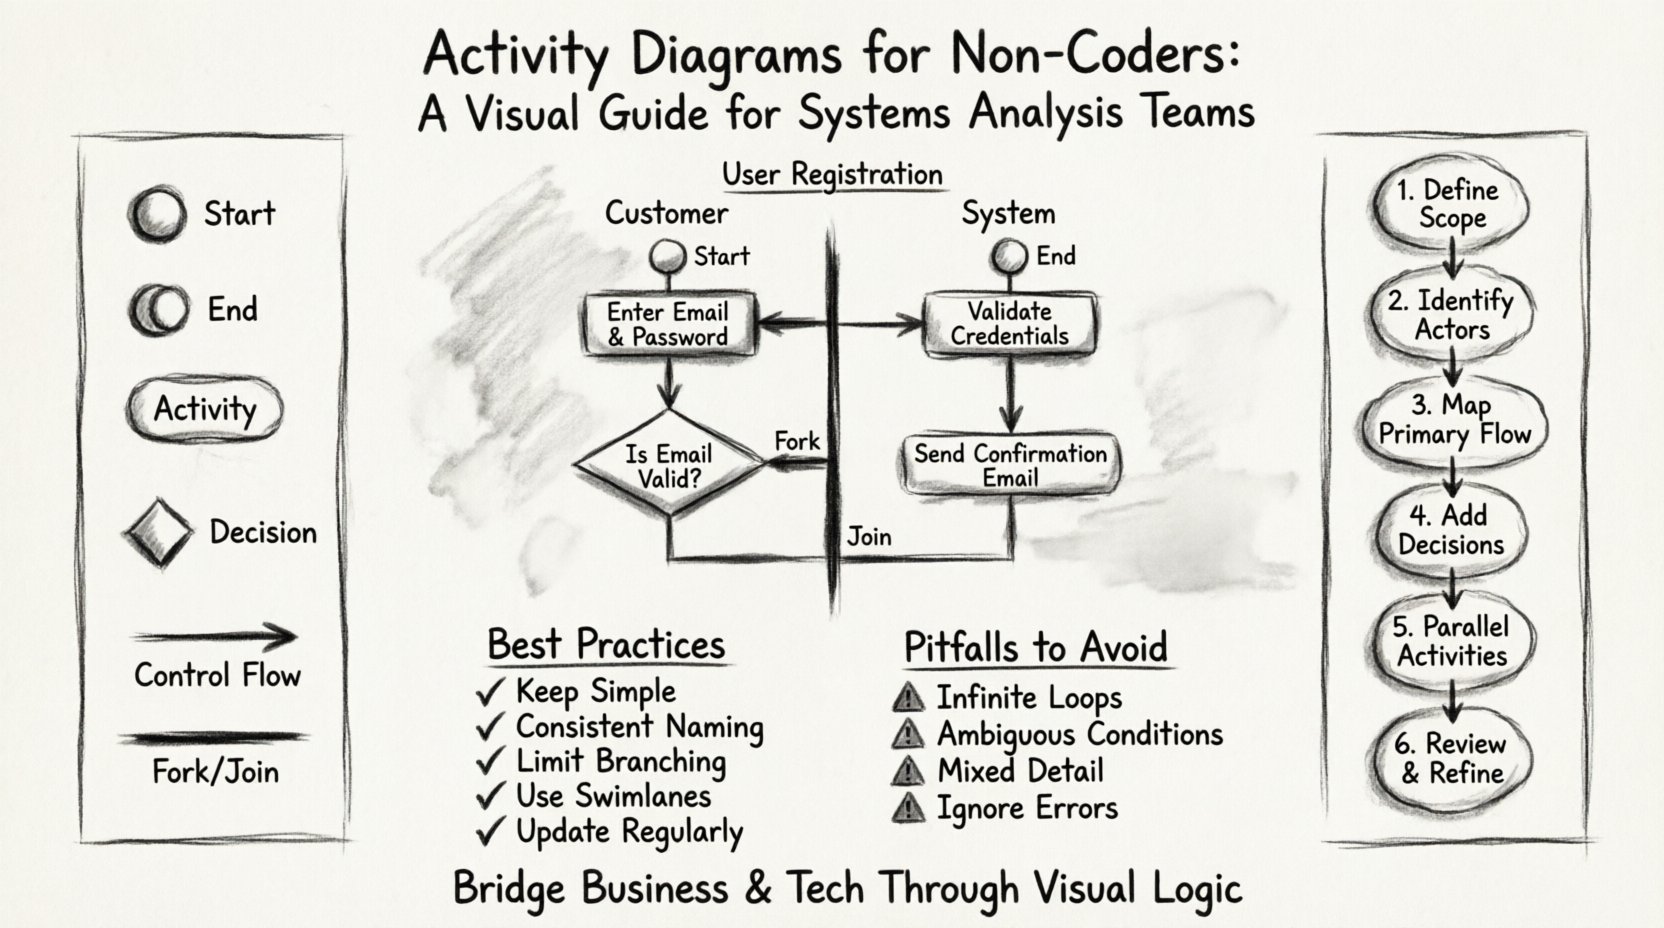
Example Scenario: User Registration Process 📋
To illustrate these concepts, let us look at a practical example. Imagine a system where a new user needs to register for a service. Here is how the activity flow might look.
Actor: Customer
- Start: User clicks “Sign Up”
- Action: Enters email and password
- Decision: Is the email valid?
- Action: If valid, send verification code
Actor: System
- Action: Check database for existing email
- Action: Create user profile record
- Action: Send welcome email
Actor: Customer
- Action: Checks inbox for code
- Action: Enters verification code
- Decision: Is code correct?
- End: Account Activated
By mapping this out, the systems analysis team can see that the “Check database” step must happen before the “Create profile” step. It also highlights that the user cannot proceed without the verification code. This logic is often missed in text-only requirements.
Best Practices for Clear Diagrams ✨
To ensure your activity diagrams remain effective tools for communication, adhere to these guidelines. Good diagrams are readable, maintainable, and accurate.
- Keep it Simple: If a diagram is too complex to read on a single screen, it is too complex. Break large processes into sub-diagrams. Use a high-level diagram for the overview and detailed diagrams for specific modules.
- Consistent Naming: Use action verbs for activities (e.g., “Submit Form”, “Process Payment”) rather than nouns (e.g., “Form Submission”). This implies action and flow.
- Limit Branching: Avoid excessive decision points in a single view. Too many “Yes/No” branches create a “spaghetti diagram” that is hard to follow. Group related logic together.
- Use Swimlanes Wisely: Swimlanes are powerful, but too many of them make the diagram wide and unwieldy. If you have more than 5-6 actors, consider grouping them or creating separate diagrams for each actor’s perspective.
- Update Regularly: A diagram is only useful if it reflects the current state of the system. Treat the diagram as a living document that is updated whenever a process changes.
Common Pitfalls to Avoid ⚠️
Even experienced analysts can fall into traps when modeling workflows. Being aware of these common mistakes can save time and prevent confusion.
1. Infinite Loops
Ensure that every path eventually leads to an end node. A decision diamond that always routes back to the previous step without a termination condition creates an infinite loop. This is a critical logic error.
2. Ambiguous Conditions
Labels on decision arrows should be clear. Avoid vague terms like “Check” or “Verify”. Instead, use “Valid Data” or “Invalid Data”. The condition must be binary or clearly defined to avoid misinterpretation.
3. Mixing Levels of Detail
Do not combine high-level business steps with low-level technical steps. If one box says “Call API” and another says “Verify Credit Score”, the audience will be confused about the level of abstraction. Keep the diagram at one level of granularity.
4. Ignoring Error Handling
Most diagrams focus on the success path. However, systems analysis must account for failure. Ensure that error states (e.g., “Network Timeout”, “Invalid Input”) are mapped out, even if they lead to a separate error-handling sub-process.
Integrating Diagrams into Systems Analysis 🧩
Activity diagrams are not just standalone documents; they are integral parts of the systems analysis lifecycle. They fit into various phases of development.
Requirements Gathering
During the initial phase, activity diagrams help elicit requirements. By drawing the process as the stakeholder describes it, you can immediately see gaps in their understanding. This collaborative drawing process often reveals hidden requirements.
Design Phase
Developers use the activity diagram to understand the control flow of the application. It informs the architecture, particularly regarding how different modules interact. For non-coders, this ensures the design aligns with the business logic they care about.
Testing Phase
Testers use the diagram to create test cases. Every path in the diagram represents a potential test scenario. This ensures 100% path coverage for the logic defined in the diagram.
Documentation
The diagram serves as documentation for future maintenance. When new staff join the team, the activity diagram provides a quick overview of how the system operates without requiring them to read the codebase.
Collaboration Across Teams 🤝
The value of activity diagrams is maximized when they are used as a collaborative tool. They break down silos between departments.
Business vs. Development
Business teams focus on value and efficiency. Development teams focus on feasibility and stability. The activity diagram acts as a negotiation table. If the business wants a step that is technically impossible, the diagram highlights the conflict immediately.
Development vs. Testing
Developers implement the logic shown in the diagram. Testers verify that the implementation matches the diagram. If the diagram is accurate, testing becomes a verification exercise rather than a discovery exercise.
Stakeholder Engagement
Executive stakeholders often lack the time to read detailed specs. An activity diagram provides a high-level view of the project scope. It allows leadership to approve processes based on visual confirmation of the workflow.
Advanced Concepts: Object Flow and States 🔄
While control flow shows the sequence of actions, object flow shows the movement of data. Understanding the distinction is vital for systems analysis.
Control Flow: This is the “when”. It dictates the order of operations. It looks like the steps in a recipe.
Object Flow: This is the “what”. It shows the data being passed between steps. For example, a “Customer Object” might be created in one step and used in another.
Combining both flows in a diagram provides a complete picture. However, for non-coders, it is often better to start with control flow only. Adding object flow can complicate the visual. Introduce data flow only when the process logic is fully understood and stable.
Maintenance and Version Control 📂
Software systems evolve. Business rules change. An activity diagram that was accurate last year may be obsolete today. Establish a protocol for diagram maintenance.
- Versioning: Save versions of your diagrams when significant changes occur. This allows you to revert if a new implementation fails.
- Change Logs: Keep a record of who updated the diagram and why. This provides context for future reviewers.
- Accessibility: Ensure the diagrams are stored in a central repository where all team members can access the latest version. Avoid sending diagrams as email attachments.
Conclusion on Visual Modeling 🏁
Activity diagrams are a fundamental tool for systems analysis. They translate abstract business concepts into concrete visual logic. For non-coders, they offer a way to participate directly in the design process. By understanding the core symbols, following best practices, and avoiding common pitfalls, you can create diagrams that drive clarity and efficiency.
The goal is not to create art, but to create communication. A good diagram is one that everyone on the team can read and understand without needing a translator. When this happens, the gap between business needs and technical delivery narrows significantly. The result is a system that works as intended, delivered with fewer errors and less rework.
Start with the basics. Draw one process. Review it. Refine it. Repeat. Over time, the ability to model complex systems visually becomes second nature. This skill empowers you to lead discussions, validate requirements, and ensure that the final product delivers real value.