Designing complex systems requires clear communication. Developers, stakeholders, and architects must share a common understanding of how a system works before writing a single line of code. Two dominant visual languages exist for this purpose: Unified Modeling Language (UML) and traditional flowcharts. While they often appear similar on the surface, they serve fundamentally different purposes. Choosing the right tool impacts clarity, maintenance costs, and system scalability.
This guide explores the distinctions between these modeling techniques. We will examine their origins, structural differences, and specific application scenarios. By the end, you will know precisely which diagram type fits your current project needs.
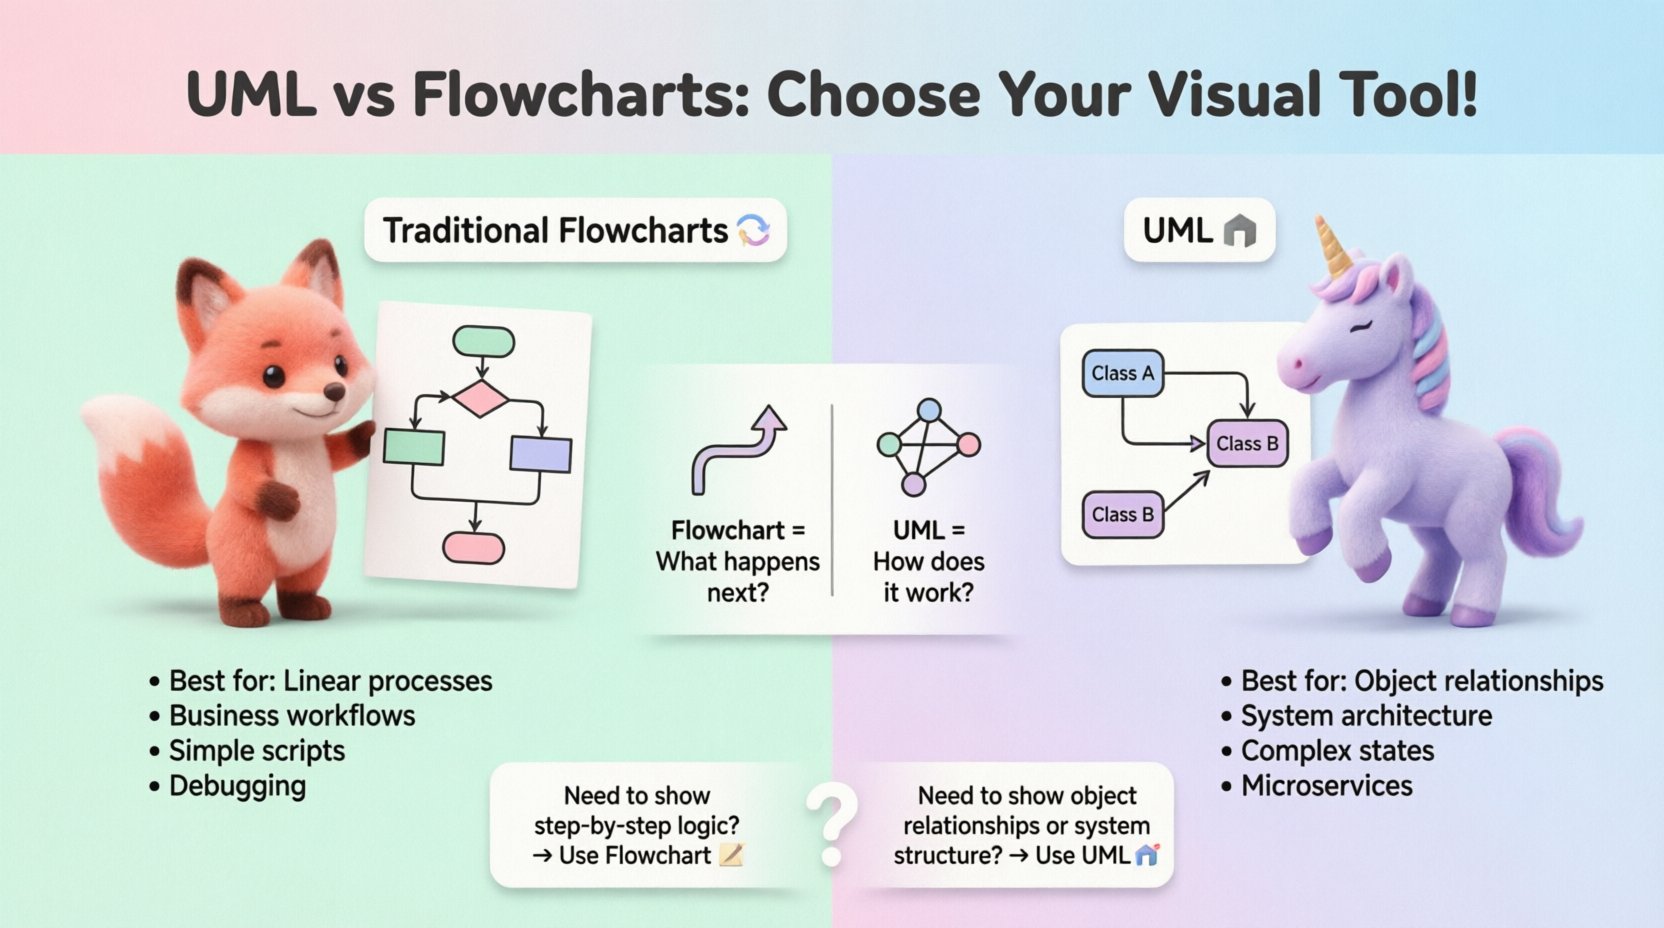
Understanding Traditional Flowcharts 🔄
Flowcharts predate modern software engineering. They originated in the 1920s for manufacturing processes and were adopted by computing in the 1950s. Their primary goal is to map out a process or algorithm step-by-step. They represent control flow rather than structural relationships.
Core Components of a Flowchart
- Terminator: An oval shape representing the start or end of a process.
- Process: A rectangle indicating an action or operation.
- Decision: A diamond shape for conditional logic (Yes/No paths).
- Input/Output: A parallelogram for data entry or display.
- Connector: A circle linking different parts of the diagram across pages.
Best Use Cases for Flowcharts
- Algorithm Logic: Describing how data moves through a specific calculation.
- Business Processes: Mapping out a workflow for non-technical stakeholders, such as an approval chain.
- Simple Scripts: Outlining the execution path of a short program function.
- Debugging: Tracing where a process fails when it deviates from the expected path.
Flowcharts excel at linear progression. They answer the question: “What happens next?” However, they struggle to represent object relationships, state persistence, or concurrent processes effectively.
Understanding Unified Modeling Language (UML) 🏗️
Introduced in the 1990s, UML was created to standardize the documentation of object-oriented systems. It is not a programming language but a visual language for specifying, constructing, and documenting the artifacts of software systems. UML divides diagrams into two categories: structural and behavioral.
Structural Diagrams
- Class Diagram: Shows the static structure, including classes, attributes, and relationships (inheritance, association).
- Object Diagram: Represents a snapshot of instances at a specific moment in time.
- Component Diagram: Illustrates the physical implementation units, such as libraries or files.
- Deployment Diagram: Maps hardware nodes and software artifacts.
Behavioral Diagrams
- Use Case Diagram: Defines interactions between actors and the system.
- Sequence Diagram: Details how objects interact over time to execute a scenario.
- Activity Diagram: Similar to a flowchart but designed for complex workflows and concurrency.
- State Machine Diagram: Describes how an object changes state based on events.
Why UML Matters
- Abstraction: It separates logical design from physical implementation.
- Scalability: It handles complex systems where multiple objects interact simultaneously.
- Standardization: It provides a common vocabulary for international teams.
Key Differences: Flowchart vs. UML 🆚
While both use shapes and arrows, the intent behind the shapes differs significantly. A flowchart focuses on process steps, whereas UML focuses on system architecture and interactions.
| Feature | Traditional Flowchart | UML |
|---|---|---|
| Primary Focus | Control flow and logic steps | Structure, behavior, and relationships |
| Context | Procedural or business process | Object-oriented or system architecture |
| Concurrency | Difficult to represent | Supported (e.g., in Activity Diagrams) |
| Object State | Not represented | Critical (State Machine Diagrams) |
| Complexity | Best for simple to moderate | Designed for complex systems |
| Standard | Informal variations common | Strict ISO/OMG standards |
When to Use Traditional Flowcharts 📝
Select a flowchart when the problem is linear and the audience includes non-technical stakeholders. These diagrams are excellent for defining the “how” of a specific task.
Scenario 1: Simple Algorithm Logic
If you are writing a script to validate user input, a flowchart clarifies the decision tree. For example, checking if a field is empty, then checking if it contains an email format, and finally confirming it is not blocked.
- Start ➡️ Check Input ➡️ Is Empty? ➡️ Yes (Show Error) / No ➡️ Check Format ➡️ End.
Scenario 2: Business Workflow Approval
When a finance team needs to understand how a purchase order moves through the company, UML is too abstract. A flowchart shows the approval chain clearly: Manager ➡️ Director ➡️ Finance ➡️ Vendor.
Scenario 3: Troubleshooting Guides
IT support teams often use flowcharts to guide technicians through diagnostic steps. If the server is down, check power, then check network, then check services. This logical path is intuitive for troubleshooting.
When to Use UML 🧩
Switch to UML when designing the backbone of a software system. It captures relationships that flowcharts miss, such as inheritance, polymorphism, and asynchronous communication.
Scenario 1: Database Schema Design
A flowchart cannot show that a User class has a one-to-many relationship with an Order class. A Class Diagram explicitly defines cardinality, foreign keys, and data types. This is vital for database engineers.
Scenario 2: System Interaction
When a mobile app sends data to a server, multiple objects interact. A Sequence Diagram shows the message passing order, lifelines, and activation periods. It reveals bottlenecks in communication that a flowchart hides.
Scenario 3: Complex State Management
Consider an e-commerce order. An order can be “Pending,” “Paid,” “Shipped,” or “Cancelled.” A state machine diagram maps every transition and the events that trigger them. A flowchart would become a tangled web of diamonds trying to represent this state history.
Scenario 4: Microservices Architecture
For distributed systems, a Component or Deployment Diagram illustrates how services talk to each other. It helps identify single points of failure and data synchronization needs across different nodes.
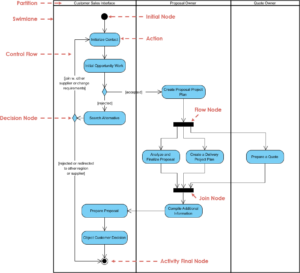
Navigating the Gray Areas 🌫️
Sometimes the line blurs. An UML Activity Diagram looks very similar to a flowchart. How do you distinguish them?
- Swimlanes: UML Activity Diagrams heavily utilize swimlanes to denote responsibility (e.g., System vs. User). Flowcharts use them less frequently.
- Fork/Join: UML supports explicit parallel execution threads (fork nodes). Traditional flowcharts usually imply parallelism but lack standard notation for it.
- Objects: UML diagrams reference specific objects or classes. Flowcharts reference generic actions or processes.
If your diagram describes what the system is made of, use UML. If it describes what happens step-by-step, use a Flowchart.
Common Pitfalls to Avoid ⚠️
Choosing the wrong diagram type leads to confusion and rework. Here are frequent mistakes teams make.
Pitfall 1: Over-Engineering with UML
Using a full UML suite for a simple landing page is wasteful. A Class Diagram for a static HTML page adds unnecessary complexity. Keep documentation proportional to system complexity.
Pitfall 2: Using Flowcharts for State
Attempting to map a state machine using flowchart diamonds leads to “spaghetti code” visuals. If the system has states that persist beyond a single function call, a State Machine Diagram is required.
Pitfall 3: Ignoring the Audience
Showing a Sequence Diagram to a marketing manager will confuse them. Use flowcharts or Use Case diagrams for business stakeholders. Reserve technical diagrams for engineering teams.
Pitfall 4: Outdated Documentation
Diagrams that do not match the code are worse than no diagrams. They create false expectations. If you cannot maintain the visual model alongside the code, simplify your documentation strategy.
Communication and Collaboration 🤝
The value of these diagrams lies in team alignment. Visual models reduce ambiguity in requirements gathering.
For Developers
UML serves as a blueprint for implementation. It allows senior engineers to review the architecture before junior developers write code. This reduces refactoring costs later in the lifecycle.
For Stakeholders
Flowcharts translate technical logic into business value. They help product managers understand the effort required for specific features by visualizing the decision paths.
For Maintenance
When a developer joins a new project, documentation accelerates onboarding. A clear Class Diagram explains the codebase structure faster than reading raw source files.
Integration in the Development Lifecycle 🛠️
Where do these diagrams fit in the standard software development lifecycle (SDLC)?
- Requirements Phase: Use Use Case Diagrams and Flowcharts to capture functional requirements.
- Design Phase: Use Class, Sequence, and Component diagrams to define the architecture.
- Implementation Phase: Reference diagrams to ensure code matches the design.
- Testing Phase: Use activity diagrams to define test scenarios and coverage.
- Maintenance Phase: Update diagrams to reflect changes in the live system.
Agile methodologies sometimes discourage heavy upfront design. However, lightweight UML sketches or flowcharts remain valuable for sprint planning and backlog refinement.
Future Proofing Your Documentation 🔮
As systems evolve, so do the tools used to design them. Cloud-native architectures and event-driven systems require more dynamic modeling than traditional monolithic apps.
- Microservices: Require detailed sequence and deployment diagrams to map API contracts.
- Real-time Systems: Benefit from state diagrams to handle event streams and timeouts.
- Low-Code Platforms: Often generate flowcharts automatically, but manual UML design ensures logical correctness.
Staying updated with standards ensures your diagrams remain readable for future teams. The principles of UML have remained stable, but the context in which they are applied shifts with technology.
Final Thoughts on Visual Clarity 🧭
There is no single “best” diagram. The effectiveness of a model depends on the problem being solved. Flowcharts provide clarity for processes and logic. UML provides clarity for structure and interaction.
Successful engineering teams know how to switch between these languages based on the conversation at hand. Use flowcharts to explain the flow of work. Use UML to define the skeleton of the solution. By mastering this distinction, teams reduce ambiguity, improve code quality, and ensure that the final product aligns with the original vision.
Invest time in the right visualization. It is an investment in the longevity and maintainability of your software assets.