
Unified Modeling Language (UML) serves as the backbone for visualizing, specifying, constructing, and documenting the artifacts of software systems. For a system analyst, proficiency in UML is not merely an aesthetic preference; it is a critical communication tool. It bridges the gap between abstract business requirements and concrete technical implementation. Without a standardized modeling language, teams risk misalignment, scope creep, and architectural drift.
This guide explores the core components of UML diagrams, dissecting their structures and applications. We will examine structural and behavioral models, interaction patterns, and the specific notations that define system architecture. The goal is to provide a clear, actionable understanding of how these diagrams function within the analysis lifecycle.
Why UML Matters for System Analysis 📊
System analysts act as translators. They convert stakeholder needs into technical specifications. UML provides the syntax for this translation. It allows complex systems to be broken down into manageable views. This modularity ensures that different team members can focus on specific aspects of the system without losing sight of the whole.
- Standardization: UML is an industry standard. This ensures that a diagram created by one analyst is understood by developers, testers, and other stakeholders regardless of their location or specific toolset.
- Abstraction: Analysts can model systems at various levels of detail. High-level diagrams show architecture, while detailed diagrams focus on logic and data flow.
- Documentation: Diagrams serve as living documentation. They evolve alongside the system, providing a historical record of design decisions.
- Validation: Visual models allow teams to spot logic errors, deadlocks, or missing requirements before code is written.
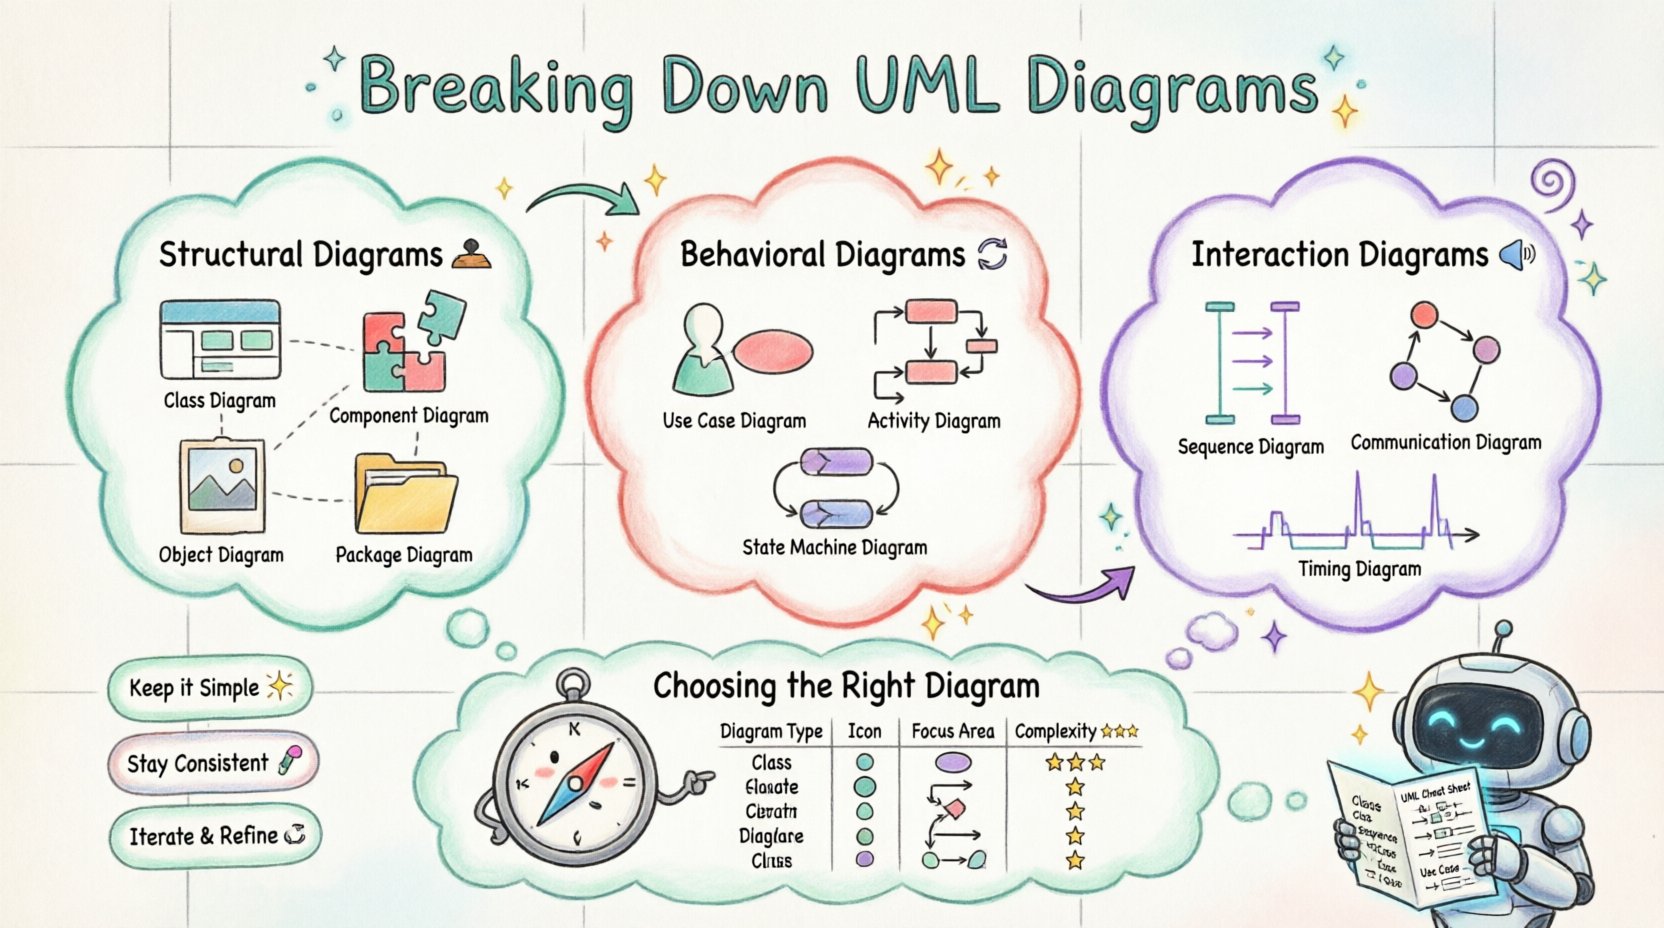
Structural Diagrams: The Skeleton of the System 🏗️
Structural diagrams focus on the static aspects of a system. They describe the objects, classes, and components that make up the architecture. These diagrams define the relationships between parts and how they are organized.
1. Class Diagram 📄
The class diagram is the most common structural diagram. It describes the structure of the system by showing the classes of the system, their attributes, operations, and the relationships among objects.
- Classes: Represented by rectangles divided into three sections. The top section contains the class name, the middle section lists attributes, and the bottom section lists operations.
- Attributes: Define the data held by a class. Access modifiers (private, protected, public) are often indicated with symbols like
-,#, or+. - Operations: Define the methods or functions available to interact with the class.
- Relationships: Connect classes together. Common types include:
- Association: A structural relationship where objects of one class are connected to objects of another. Often represented by a line.
- Aggregation: A specific type of association representing a whole-part relationship. It implies that the part can exist independently of the whole. Visualized by a diamond shape on the whole side.
- Composition: A stronger form of aggregation. The part cannot exist without the whole. If the whole is destroyed, the part is destroyed. Visualized by a filled diamond.
- Inheritance: Shows that a class derives properties from another. Represented by a solid line with a hollow triangle pointing to the parent class.
2. Component Diagram 🧩
Component diagrams model the physical implementation of the system. They show the software components, their interfaces, and dependencies. This is crucial for understanding how different modules interact at a deployment level.
- Components: Represented by a rectangle with the stereotype
<<component>>. They encapsulate implementation. - Interfaces: Defined by provided (lollipop) and required (socket) interfaces. These specify how a component interacts with others.
- Dependencies: Show that one component relies on another to function. A dashed line with an open arrowhead is standard.
Analysts use this diagram to manage modularization. It helps in identifying coupling and cohesion, which are key metrics for maintainable software.
3. Object Diagram 🖼️
An object diagram represents a snapshot of the system at a specific moment in time. It is an instance of a class diagram. While class diagrams show the blueprint, object diagrams show the actual data populated within that blueprint.
- Usage: Useful for debugging and verifying the validity of class diagrams.
- Scope: Typically used for complex relationships that are hard to visualize in a class diagram.
4. Package Diagram 📂
Package diagrams organize elements into groups or namespaces. As systems grow, the number of classes and components increases. Packages help manage this complexity.
- Structure: Represented by a folder icon. They can contain other packages, classes, or components.
- Dependencies: Show which packages depend on others. This helps in defining boundaries between subsystems.
Behavioral Diagrams: The Logic of the System 🔄
Behavioral diagrams describe the dynamic aspects of a system. They focus on the actions and interactions that occur over time. These diagrams are essential for understanding how the system responds to events.
1. Use Case Diagram 🎯
Use case diagrams capture the functional requirements of a system from the perspective of an external user. They define who the actors are and what they can do.
- Actors: Represented by stick figures. An actor can be a human user, an external system, or a hardware device.
- Use Cases: Represented by ovals. Each oval represents a specific function or goal the actor can achieve.
- Relationships:
- Association: Connects actors to use cases.
- Include: Indicates that one use case always includes another. Shown by a dashed line with the stereotype
<<include>>. - Extend: Indicates that a use case can optionally add behavior to another. Shown by a dashed line with the stereotype
<<extend>>.
2. Activity Diagram 🚦
Activity diagrams model the flow of control or data from activity to activity. They are similar to flowcharts but support concurrency and parallel processing.
- Nodes: Represent activities, decisions, or waits.
- Forks: Represent the start of parallel flows. A thick black bar splits one flow into multiple concurrent flows.
- Junctions: Represent the merging of parallel flows back into a single flow.
- Swimlanes: Divide the diagram into sections to show which actor or component is responsible for each activity.
3. State Machine Diagram 🔄
State machine diagrams describe the states an object goes through during its lifecycle in response to events. They are particularly useful for complex objects with distinct states.
- States: Represented by rounded rectangles. A state defines a condition during which an object satisfies a criterion or performs an activity.
- Transitions: Represented by arrows connecting states. They show how the object moves from one state to another.
- Events: Trigger the transitions. An event can be a signal, a time trigger, or a completion of an activity.
Interaction Diagrams: Communication Patterns 🗣️
Interaction diagrams focus on the interaction between objects. They show how objects exchange messages to achieve a specific goal.
1. Sequence Diagram 📉
Sequence diagrams are time-oriented. They show the order of messages exchanged between objects. This is one of the most detailed diagrams for system logic.
- Lifelines: Vertical dashed lines representing objects or participants.
- Activation Bars: Rectangular bars on the lifeline indicating when an object is performing an action.
- Messages: Horizontal arrows between lifelines. They can be synchronous (solid arrow) or asynchronous (dashed arrow).
- Focus of Control: Indicates the active period of an object.
2. Communication Diagram 📞
Communication diagrams (formerly collaboration diagrams) focus on the structural organization of objects rather than the timing. They show the links between objects and the messages sent along those links.
- Focus: Highlights the relationships between objects more than the sequence.
- Numbering: Messages are numbered to indicate order (e.g., 1, 1.1, 1.2).
3. Timing Diagram ⏱️
Timing diagrams focus on the timing constraints of messages and state changes. They are used for real-time systems where timing is critical.
- X-Axis: Represents time.
- Y-Axis: Represents different objects or lifelines.
Selecting the Right Diagram for the Task 🧭
A system analyst must know when to use which diagram. Using the wrong model can lead to confusion or missing information. The table below summarizes the primary use cases for each diagram type.
| Diagram Type | Primary Focus | Best Used For | Complexity |
|---|---|---|---|
| Class Diagram | Static Structure | Database design, object relationships | Medium |
| Component Diagram | Physical Modules | Deployment, library dependencies | Medium |
| Use Case Diagram | Functional Requirements | Stakeholder communication, scope definition | Low |
| Sequence Diagram | Interaction Flow | API logic, complex workflows | High |
| Activity Diagram | Process Flow | Business processes, algorithms | Medium |
| State Machine Diagram | Object Lifecycle | Event-driven systems, complex states | High |
| Package Diagram | Organization | Large system organization, namespaces | Low |
Best Practices for System Analysts ✅
Creating diagrams is an art that requires discipline. Analysts should adhere to specific guidelines to ensure the models remain useful throughout the project lifecycle.
- Consistency is Key: Use standard notation throughout all diagrams. Mixing notations confuses readers and reduces the professional quality of the documentation.
- Keep it Simple: Avoid clutter. If a diagram has too many elements, it becomes unreadable. Break complex systems into sub-systems and create separate diagrams for each view.
- Iterative Refinement: Models evolve. Do not treat the initial diagram as the final truth. Update diagrams as requirements change and as the design matures.
- Layering: Use different levels of abstraction. A high-level diagram for management, a mid-level for developers, and a detailed level for implementation.
- Naming Conventions: Use clear, descriptive names for classes, attributes, and operations. Avoid abbreviations that are not industry standard.
Common Pitfalls to Avoid ❌
Even experienced analysts can fall into traps that reduce the value of UML models. Being aware of these common mistakes helps maintain high-quality documentation.
- Over-Modeling: Creating diagrams for every minor detail can waste time. Focus on what is critical for understanding the architecture.
- Inconsistency: If a class diagram shows a relationship that a sequence diagram ignores, it creates confusion. All diagrams must align logically.
- Ignoring Constraints: Failing to document business rules or validation logic within the models can lead to implementation errors.
- Lack of Context: Diagrams should not exist in a vacuum. They should reference the requirements or use cases they satisfy.
- Static vs. Dynamic Confusion: Do not use a class diagram to show runtime behavior. Use a sequence or activity diagram for that purpose.
Deep Dive: Relationships and Multiplicity 🔗
Understanding the nuances of relationships is vital for accurate modeling. Multiplicity defines how many instances of one class relate to one instance of another.
- One-to-One: A single instance relates to exactly one instance of another class. Example: A person and their passport.
- One-to-Many: A single instance relates to many instances of another class. Example: A department and its employees.
- Many-to-Many: Many instances of one class relate to many instances of another. Example: Students and Courses.
Multiplicity is expressed using cardinality notation. Common symbols include:
- 1: Exactly one.
- 0..1: Zero or one (optional).
- 1..*: One or more.
- 0..*: Zero or more.
Correctly defining these relationships prevents data integrity issues in the final system. It ensures that the database schema aligns with the logical model.
Integrating UML into the Analysis Process 🛠️
UML is not a separate phase; it is integrated into the analysis process. It starts early and continues through to deployment.
- Requirements Gathering: Use Use Case diagrams to validate requirements with stakeholders.
- Conceptual Design: Create high-level class and component diagrams to define the architecture.
- Logical Design: Refine the class diagram to include detailed attributes and methods.
- Behavioral Design: Develop sequence and activity diagrams to define the logic flows.
- Validation: Walk through the diagrams with the development team to ensure feasibility.
This iterative approach ensures that the visual models remain relevant. It allows for early detection of design flaws. By catching issues at the diagramming stage, the cost of fixing them is significantly lower than after coding begins.
Advanced Concepts: Stereotypes and Profiles 🏷️
UML allows for extension through stereotypes. These are custom notations that add specific meaning to standard elements.
- Standard Stereotypes:
<<entity>>,<<boundary>>,<<control>>(MVC pattern). - Custom Profiles: Teams can define their own profiles to match specific domain requirements. For example, a healthcare system might have a
<<patient>>stereotype.
Using stereotypes correctly enhances the clarity of the model. It allows analysts to convey domain-specific knowledge without cluttering the diagram with text notes.
Final Thoughts on UML Proficiency 🚀
Proficiency in UML is a skill that develops over time. It requires practice, review, and a willingness to adapt. For system analysts, it is the primary lens through which they view the complexity of software. By mastering the breakdown of these diagrams, analysts can ensure that their systems are built on a solid foundation of clear communication and logical design.
Remember that the diagram is a tool, not the end product. Its value lies in the understanding it generates. Keep the focus on clarity, accuracy, and alignment with business goals. This approach will yield systems that are robust, maintainable, and aligned with user needs.
Continuously refine your modeling skills. Stay updated with UML standards, as they evolve to meet new technological demands. The ability to visualize complex systems remains one of the most valuable assets in the technology landscape.