
Unified Modeling Language (UML) provides a standardized way to visualize the design of a system. Among the various diagram types available, the UML activity diagram stands out as a powerful tool for modeling workflows. It combines elements of structured programming and object-oriented design to represent the dynamic behavior of a system. Whether you are analyzing a business process or defining a software algorithm, activity diagrams offer clarity through visual representation.
This guide explores the structure, components, and best practices for creating effective activity diagrams. We will move beyond simple definitions to understand how these diagrams facilitate communication between stakeholders and developers.
🎯 Understanding the Core Purpose
An activity diagram describes the flow of control and data through a system. It is essentially a flowchart that shows the sequence of actions. Unlike sequence diagrams which focus on object interaction over time, activity diagrams focus on the transformation of data and control flow from one state to another.
- Workflow Representation: It maps out the steps required to complete a specific task or process.
- Logic Visualization: It illustrates decision points, loops, and parallel processing.
- Stakeholder Communication: It serves as a bridge between technical teams and business users.
When modeling business processes, these diagrams help identify bottlenecks, redundant steps, or areas where automation is possible. They are particularly useful for understanding complex logic that involves branching paths.
🛠️ Key Components and Notation
To create a valid activity diagram, one must understand the standard symbols used. These symbols act as the vocabulary of the diagram. Consistency in notation ensures that anyone reading the diagram interprets the logic correctly.
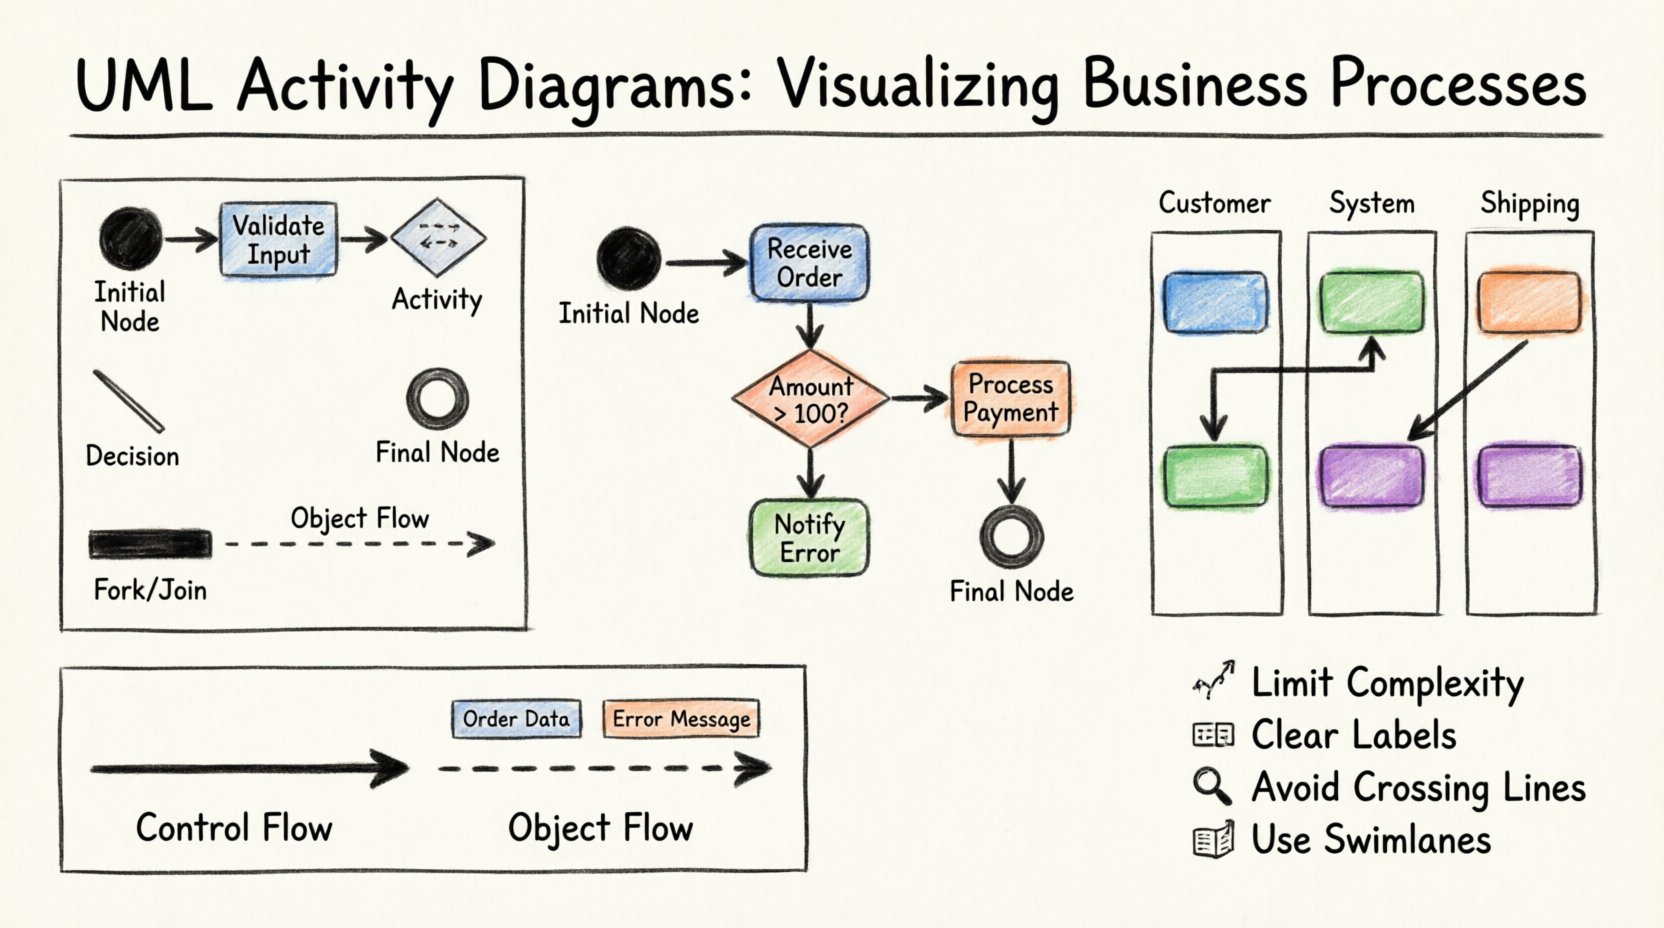
1. Initial Node
The process begins at the initial node. This is represented by a solid black circle. It signifies the starting point of the activity flow. There should be only one initial node per activity diagram to define a clear entry point.
2. Activity States
Actions or activities are depicted as rounded rectangles. These represent a unit of work. For example, “Validate User Input” or “Process Order”. Inside these shapes, you can specify the action being performed.
3. Final Node
The process ends at a final node. This is a solid black circle surrounded by a ring. It indicates that the activity flow has completed successfully. Some models include multiple final nodes to represent different outcomes (e.g., success vs. error).
4. Decision Nodes
Logic branches are managed using decision nodes. Shown as a diamond shape, these nodes allow the flow to split based on a condition. Only one outgoing path is taken at a time. Labels on the outgoing edges specify the condition (e.g., “Yes”, “No”, “Amount > 100”).
5. Control Flow
The arrows connecting these nodes represent control flow. They indicate the order in which activities are executed. The direction of the arrow is crucial for understanding the sequence.
Table: Common Symbols and Meanings
| Symbol | Shape | Meaning |
|---|---|---|
| Initial Node | ● (Solid Circle) | Start of the process |
| Activity | Rounded Rectangle | A specific action or step |
| Decision | Diamond | A branching point based on a condition |
| Fork/Join | Thick Bar | Parallel execution or synchronization |
| Final Node | ◎ (Circle with Ring) | End of the process |
| Object Flow | Dashed Line with Arrow | Movement of data or objects |
📊 Control Flow vs Object Flow
Activity diagrams distinguish between the movement of control and the movement of data. Understanding this distinction is vital for accurate modeling.
Control Flow
Control flow dictates when an activity happens. It determines the sequence of execution. For example, a decision node controls whether a loop continues or terminates. This is the backbone of the diagram’s logic.
Object Flow
Object flow dictates what is being processed. It represents the input and output of objects or data. Object flows are often represented by dashed lines. They connect actions to objects, showing how data is transformed as it passes through the system.
- Input Objects: Data required to start an activity.
- Output Objects: Data produced by an activity.
- Object Nodes: Represent a collection of objects at a specific point in the flow.
Combining both flows provides a complete picture. Control flow shows the logic, while object flow shows the data transformation.
🏊 Swimlanes for Role Clarity
As processes become more complex, a single linear flow becomes difficult to read. Swimlanes (also known as partitions) organize activities by responsible party. This can be a specific role, a department, a system, or a physical location.
Benefits of Swimlanes
- Responsibility Assignment: It is immediately clear who is responsible for each step.
- Handoff Identification: It highlights where control passes between different entities (e.g., from “Sales” to “Finance”).
- Parallelism: It allows for visualizing independent processes occurring simultaneously within different lanes.
Implementing Swimlanes
To implement swimlanes, divide the diagram area into vertical or horizontal sections. Each section represents a specific actor. Activities within that section belong to that actor. The flow lines cross between lanes to show interaction.
For example, in an order processing system:
- Customer Lane: Place Order, Receive Confirmation.
- System Lane: Validate Inventory, Calculate Tax.
- Shipping Lane: Pack Item, Dispatch Carrier.
This structure prevents confusion regarding who performs which task. It is essential for business process modeling where multiple departments interact.
🚀 Advanced Flow Control
Beyond basic sequences and decisions, activity diagrams support advanced constructs to model complex real-world scenarios.
1. Fork and Join Nodes
These are represented by thick horizontal or vertical bars. They manage concurrency.
- Fork: Splits a single flow into multiple parallel flows. This indicates that subsequent activities happen simultaneously.
- Join: Merges multiple parallel flows into a single flow. Execution continues only after all incoming paths have completed.
This is crucial for modeling systems that handle tasks in parallel, such as downloading a file while scanning a virus.
2. Exception Handling
Not all processes complete successfully. Activity diagrams can model error states. You can create alternative paths for exceptions. For instance, if a database connection fails, the flow diverts to an error logging activity rather than the standard success path.
3. Pre-conditions and Post-conditions
You can attach constraints to activities or transitions.
- Pre-condition: A state that must be true before an activity begins.
- Post-condition: A state guaranteed to be true after an activity completes.
These notes add a layer of rigor to the model, ensuring logical consistency.
📝 Best Practices for Effective Modeling
Creating a diagram is not just about drawing shapes; it is about communicating information effectively. Follow these guidelines to ensure your diagrams are clear and useful.
1. Limit Complexity
One diagram should not cover an entire system. Break down large processes into smaller, manageable sub-activity diagrams. If a diagram becomes crowded with hundreds of nodes, it becomes unreadable. Use hierarchical modeling to drill down into details.
2. Maintain Consistency
Use the same terminology for activities across different diagrams. If “Process Order” is used in one diagram, do not use “Handle Order” in another. Consistent naming conventions reduce cognitive load for readers.
3. Avoid Crossing Lines
Layout matters. Arrange nodes so that control flow lines do not cross excessively. Crossing lines create visual noise and make tracing the path difficult. Reorder activities to minimize intersections.
4. Use Clear Labels
Every decision node should have a clear label on its outgoing edges. Avoid vague terms like “Maybe”. Use specific conditions like “Status = Active” or “Quantity > 0”.
5. Include Object Flows
Where relevant, show the data being passed. This helps developers understand the data structures required for each activity.
🚫 Common Errors to Avoid
Mistakes in modeling can lead to misunderstandings during implementation. Be aware of these common pitfalls.
- Dead Ends: Every flow must eventually reach a final node. Ensure there are no orphaned paths where the process gets stuck.
- Missing Conditions: Every decision node must have at least two outgoing paths with defined conditions.
- Incorrect Parallelism: Do not use fork/join nodes unless parallel execution is actually intended. Sequential processing should not be represented as parallel.
- Overlapping Logic: Avoid duplicating the same activity in multiple places. Use references or sub-diagrams to maintain a single source of truth.
- Ignoring Time: While activity diagrams do not explicitly model time, be aware that some activities are time-sensitive. Document these in notes if necessary.
🔗 Relationship with Other UML Diagrams
Activity diagrams do not exist in isolation. They integrate with other UML diagrams to provide a full system specification.
| Diagram Type | Focus | Relationship to Activity Diagram |
|---|---|---|
| Sequence Diagram | Interaction over time | Activity diagrams can trigger sequence diagrams for detailed object interactions. |
| State Machine Diagram | Object state changes | Activities can represent the actions taken when an object transitions states. |
| Class Diagram | Static structure | Activities operate on the classes defined in the class diagram. |
| Use Case Diagram | Functional requirements | Activity diagrams detail the internal logic of a Use Case. |
For example, a Use Case Diagram might show “User Login”. An Activity Diagram would detail the steps: Enter Password, Validate Credentials, Grant Access, or Deny Access. This layering allows for high-level overview and low-level detail.
🛠️ Step-by-Step Construction Methodology
When starting a new diagram, follow a structured approach to ensure completeness.
- Define the Scope: Determine what process is being modeled. Is it the entire system or a specific feature?
- Identify Actors: Determine who or what is involved. Create swimlanes accordingly.
- List Activities: Brainstorm all the steps involved in the process.
- Determine Flow: Arrange the steps in logical order. Identify where decisions are made.
- Add Control Structures: Insert decision nodes, forks, and joins where necessary.
- Refine Notation: Apply standard symbols and ensure consistency.
- Review: Walk through the diagram to check for dead ends and logical errors.
📈 Summary of Value
UML activity diagrams are a fundamental tool for system analysis and design. They translate abstract logic into concrete visual structures. By focusing on control flow and data flow, they provide insight into how a system behaves under various conditions.
When used correctly, they reduce ambiguity in requirements and facilitate better collaboration between business analysts and technical teams. They are not just drawings; they are specifications of behavior.
Key takeaways include:
- Clarity: Visual representation reduces misunderstandings.
- Structure: Swimlanes and partitions organize complex processes.
- Logic: Decision nodes and flows map out conditional behavior.
- Integration: They complement other UML diagrams for a holistic view.
Adhering to standard notation and best practices ensures that the diagrams remain useful throughout the project lifecycle. Whether for business process improvement or software development, these diagrams provide the necessary roadmap for success.