
System architecture planning requires clear visualization of how software systems are structured. The Unified Modeling Language (UML) provides a standardized way to document these structures. Among the various diagram types, the component diagram stands out for its ability to show the physical building blocks of a system. This guide explores the mechanics, usage, and significance of UML component diagrams in architectural design.
When planning complex software, developers and architects need to understand how parts interact. A component diagram helps visualize these interactions without getting bogged down in implementation details. It focuses on the modular nature of the software. By breaking down a system into manageable units, teams can manage complexity effectively. This approach supports maintainability and scalability.
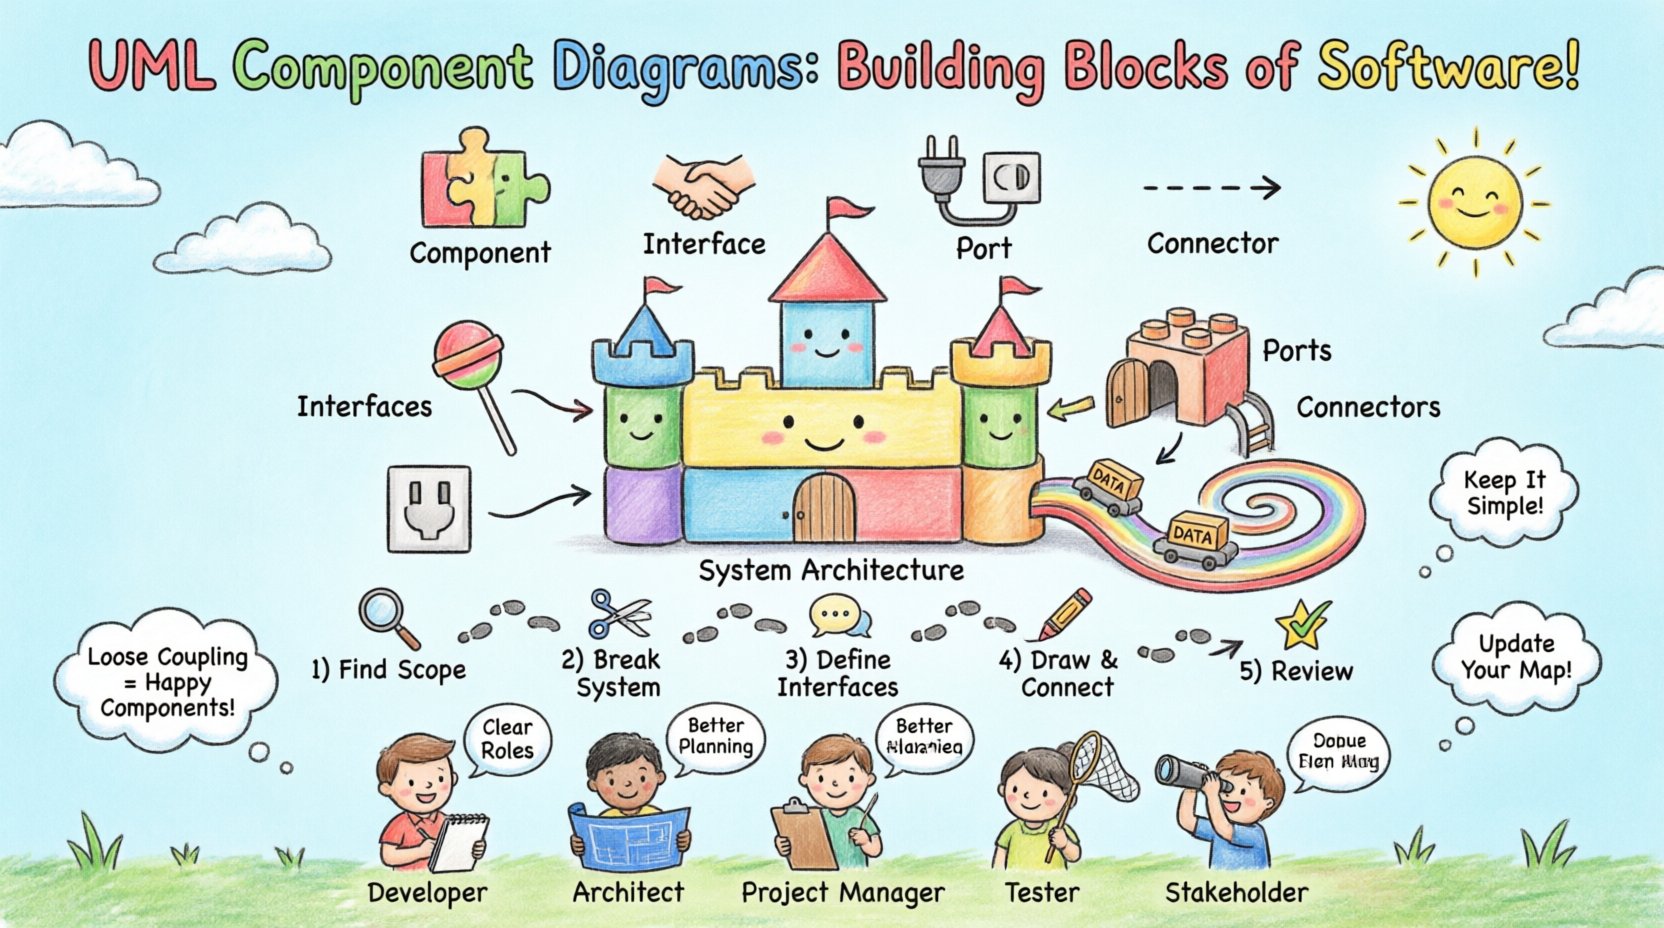
Core Concepts and Definitions 🧩
Before drawing a diagram, it is essential to understand the fundamental elements. Each element carries specific semantic meaning that informs how the system functions.
1. Components
A component represents a modular part of a system. It encapsulates implementation details. This means the internal logic is hidden from the outside world. External entities interact with a component only through defined interfaces. Think of a component as a black box. You know what goes in and what comes out, but not exactly how the transformation happens internally.
- Components can represent software modules, libraries, or subsystems.
- They provide functionality or services to other parts of the system.
- They can be physical artifacts, such as executable files or libraries.
- They can also be logical units, like a specific business function.
2. Interfaces
An interface defines a contract between a component and the rest of the system. It specifies the operations available to other components. It does not specify how those operations are implemented. This separation allows for flexibility. If the implementation changes, the interface remains stable.
- Interfaces are often depicted as a circle (lollipop notation) or a rectangle.
- They define the public API of a component.
- They ensure loose coupling between modules.
- They allow different components to communicate regardless of their internal language or technology.
3. Ports
Ports are specific points of interaction on a component. They connect to provided or required interfaces. A port acts as a socket where an interface is plugged in. This distinction is important for complex systems where a component might have multiple entry and exit points.
- Provided ports offer services to other components.
- Required ports request services from other components.
- Ports help manage the connection points explicitly.
- They clarify the direction of dependency.
4. Connectors
Connectors link ports to interfaces or other ports. They represent the communication paths between components. Connectors define the protocol or mechanism of interaction. They ensure that data flows correctly from a source to a destination.
- They can represent synchronous or asynchronous calls.
- They may indicate specific protocols like HTTP, TCP/IP, or local method calls.
- They show the flow of data or control signals.
- They help visualize the network topology of the software.
Visual Notation and Syntax 📐
Consistency in notation is vital for a diagram to be readable. Standard conventions ensure that any stakeholder can interpret the diagram correctly.
- Component Icon: Typically a rectangle with a small tab on the upper right corner. The name of the component is written inside.
- Interface Icon: A circle attached to a line (lollipop) indicates a provided interface. A half-circle on a line (socket) indicates a required interface.
- Port Icon: A small rectangle attached to the boundary of the component box.
- Dependency: A dashed line with an open arrow pointing from the dependent component to the component it depends on.
- Association: A solid line connecting two components.
Table: Common UML Component Elements
| Element | Symbol Description | Function |
|---|---|---|
| Component | Rectangle with tab | Represents a modular unit of functionality |
| Provided Interface | Circle (Lollipop) | Services offered by the component |
| Required Interface | Half-Circle (Socket) | Services needed by the component |
| Port | Small Rectangle on Boundary | Connection point for interfaces |
| Connector | Line | Links ports to interfaces |
| Dependency | Dashed Line + Arrow | Indicates usage relationship |
Relationships and Dependencies 🔗
Understanding how components relate to one another is critical for architecture planning. Relationships define the flow of control and data. They also indicate stability and coupling.
Dependency
This is the most common relationship. It indicates that one component relies on another to function. If the dependency changes, the dependent component might break. It is a “uses” relationship. It implies a high degree of coupling if not managed well.
- Used when Component A calls operations in Component B.
- Visualized as a dashed line with an arrow.
- Indicates that B is a prerequisite for A.
Realization (Implementation)
This relationship connects an interface to a component that implements it. It shows that the component fulfills the contract defined by the interface. This is crucial for understanding which parts of the system satisfy specific requirements.
- Visualized as a dashed line with a hollow triangle arrow.
- Connects an interface to a component.
- Shows the implementation of a contract.
Association
An association represents a structural link. It indicates that components are connected in a way that allows them to hold references to each other. This is often used for data flow or persistent connections.
- Visualized as a solid line.
- Can be labeled to describe the nature of the link.
- Often used for physical connections or data streams.
Table: Relationship Semantics
| Relationship Type | Arrow Style | Meaning |
|---|---|---|
| Dependency | Dashed, Open Arrow | Component A uses Component B |
| Realization | Dashed, Hollow Triangle | Component implements an Interface |
| Association | Solid Line | Structural or data link |
| Generalization | Solid, Hollow Triangle | Inheritance or specialization |
Designing the Diagram: A Step-by-Step Approach 📝
Creating a component diagram is not a random activity. It follows a logical process to ensure accuracy and utility.
- Identify the Scope: Define which system or subsystem is being modeled. Avoid modeling the entire enterprise at once unless necessary.
- Decompose the System: Break the system down into major functional areas. These become your initial components.
- Define Interfaces: For each component, list the services it offers and the services it needs. Do not define internal methods yet.
- Draw Components: Place the component rectangles on the canvas. Group related components logically.
- Add Interfaces: Attach the interface symbols to the appropriate components.
- Connect the Dots: Draw lines between ports and interfaces to show relationships.
- Review for Coupling: Check if components depend on each other too heavily. Aim for loose coupling.
- Validate: Ensure the diagram matches the actual architecture or design plans.
Integration with Other Diagrams 🔄
A component diagram does not exist in isolation. It interacts with other UML diagram types to provide a complete picture of the system.
Class Diagrams
Class diagrams detail the internal structure of a component. A component diagram abstracts this away. You might use a class diagram to define the internal logic of a component, while the component diagram shows how that component fits into the larger system. This separation of concerns keeps diagrams manageable.
Deployment Diagrams
Deployment diagrams show where components run. A component diagram shows what the components are. Together, they tell you how the software is distributed across hardware. This is vital for understanding infrastructure needs.
Sequence Diagrams
Sequence diagrams show the flow of messages over time. Component diagrams show the static structure. Using sequence diagrams alongside component diagrams helps verify that the structural connections actually support the required interactions.
Benefits for Different Stakeholders 👥
Different roles within a project derive value from component diagrams in specific ways.
- Developers: They use the diagram to understand module boundaries. It helps them know which libraries to import and which interfaces to implement.
- Architects: They use it to verify system decomposition. It helps them ensure that the high-level design matches the implementation plan.
- Project Managers: They use it to understand task dependencies. It helps in scheduling work based on component readiness.
- Testers: They use it to identify integration points. It helps in planning integration testing strategies.
- Stakeholders: They use it to get a high-level view of the system. It helps them understand the complexity without technical jargon.
Table: Stakeholder Value
| Role | Primary Benefit | Usage Frequency |
|---|---|---|
| Developer | Module Boundaries | High |
| Architect | System Decomposition | Medium |
| Project Manager | Dependency Tracking | Medium |
| Tester | Integration Points | Medium |
| Stakeholder | High-Level Overview | Low |
Maintaining the Diagram 🔄
Diagrams can become outdated quickly if the system evolves. Maintaining them is an ongoing task.
Version Control
Just like code, diagrams should be versioned. This allows teams to track changes over time. It helps in understanding why a change was made. It also aids in rollback scenarios if a design change introduces issues.
Automation
Where possible, generate diagrams from code. This ensures the diagram always matches the implementation. Manual diagrams are prone to drift. Automated generation reduces the maintenance burden significantly.
Review Cycles
Schedule regular reviews of the diagrams. Include them in design review meetings. If a component changes, the diagram should be updated as part of the definition of done. This keeps the documentation current.
Common Pitfalls to Avoid ⚠️
Even experienced practitioners make mistakes when creating these diagrams. Being aware of common errors helps in producing better models.
1. Over-Engineering
Trying to model every single class as a component creates a messy diagram. Components should be coarse-grained. They should represent significant units of functionality, not small functions or variables.
2. Ignoring Interfaces
Connecting components directly without interfaces removes the abstraction. This leads to tight coupling. Always define interfaces explicitly to allow for swapping implementations later.
3. Mixing Concerns
Do not mix logical components with physical deployment nodes on the same diagram. Keep the structure separate from the deployment. Mixing them confuses the reader about what is code and what is hardware.
4. Lack of Context
A diagram without a legend or key is hard to read. Use consistent notation. Ensure all symbols are explained if they are non-standard. Context is key for interpretation.
5. Ignoring External Systems
Systems rarely exist in a vacuum. External APIs, third-party services, and databases should be represented as components. Ignoring them leads to incomplete architecture models.
Advanced Considerations 🚀
As systems grow, simple component diagrams may not suffice. Advanced modeling techniques can add depth.
Subsystems
Large components can be nested. You can create a component that contains other components. This is useful for subsystems. It allows you to drill down into complexity only when necessary.
Frameworks
Frameworks impose constraints on the components that use them. You can model these constraints using specific relationship types. This helps in understanding the architectural patterns being employed.
Deployment Context
While separate diagrams exist for deployment, adding context to component diagrams can be helpful. You can annotate components with deployment nodes. This bridges the gap between logic and physical infrastructure.
Final Considerations 🏁
UML component diagrams are powerful tools for system architecture planning. They provide a clear view of the system’s modularity. They help manage complexity by breaking large systems into smaller parts. They facilitate communication between different teams.
Using them effectively requires discipline. Stick to the standard notation. Keep the components coarse-grained. Maintain the diagrams as the system evolves. Avoid common pitfalls like over-engineering or ignoring interfaces.
When integrated with other modeling techniques, they form a robust documentation strategy. They support the entire lifecycle of the software. From initial planning to maintenance and evolution, they provide a reference point. By understanding and applying these principles, teams can build systems that are easier to understand and modify.
The goal is clarity. A good diagram should make the architecture obvious to anyone who reads it. It should serve as a map for the development journey. With careful planning and execution, component diagrams become an asset rather than a burden.