
Unified Modeling Language (UML) serves as the universal blueprint for software architecture. It provides a standardized way to visualize, specify, construct, and document the artifacts of a system. However, the suite of diagram types available can be overwhelming. Selecting the wrong model type can lead to confusion, miscommunication, or wasted effort during the development lifecycle. 🛠️
This guide provides a detailed breakdown of UML diagram types, their specific use cases, and a strategic framework for choosing the right visualization for your project. By understanding the distinctions between structural and behavioral modeling, teams can ensure clarity and precision in system design. 📐
Understanding the Core Categories 🏗️
Before diving into specific diagram types, it is essential to understand the two primary pillars of UML modeling. Every diagram falls into one of these categories, defining whether it represents the static structure or the dynamic behavior of the system. 🌲
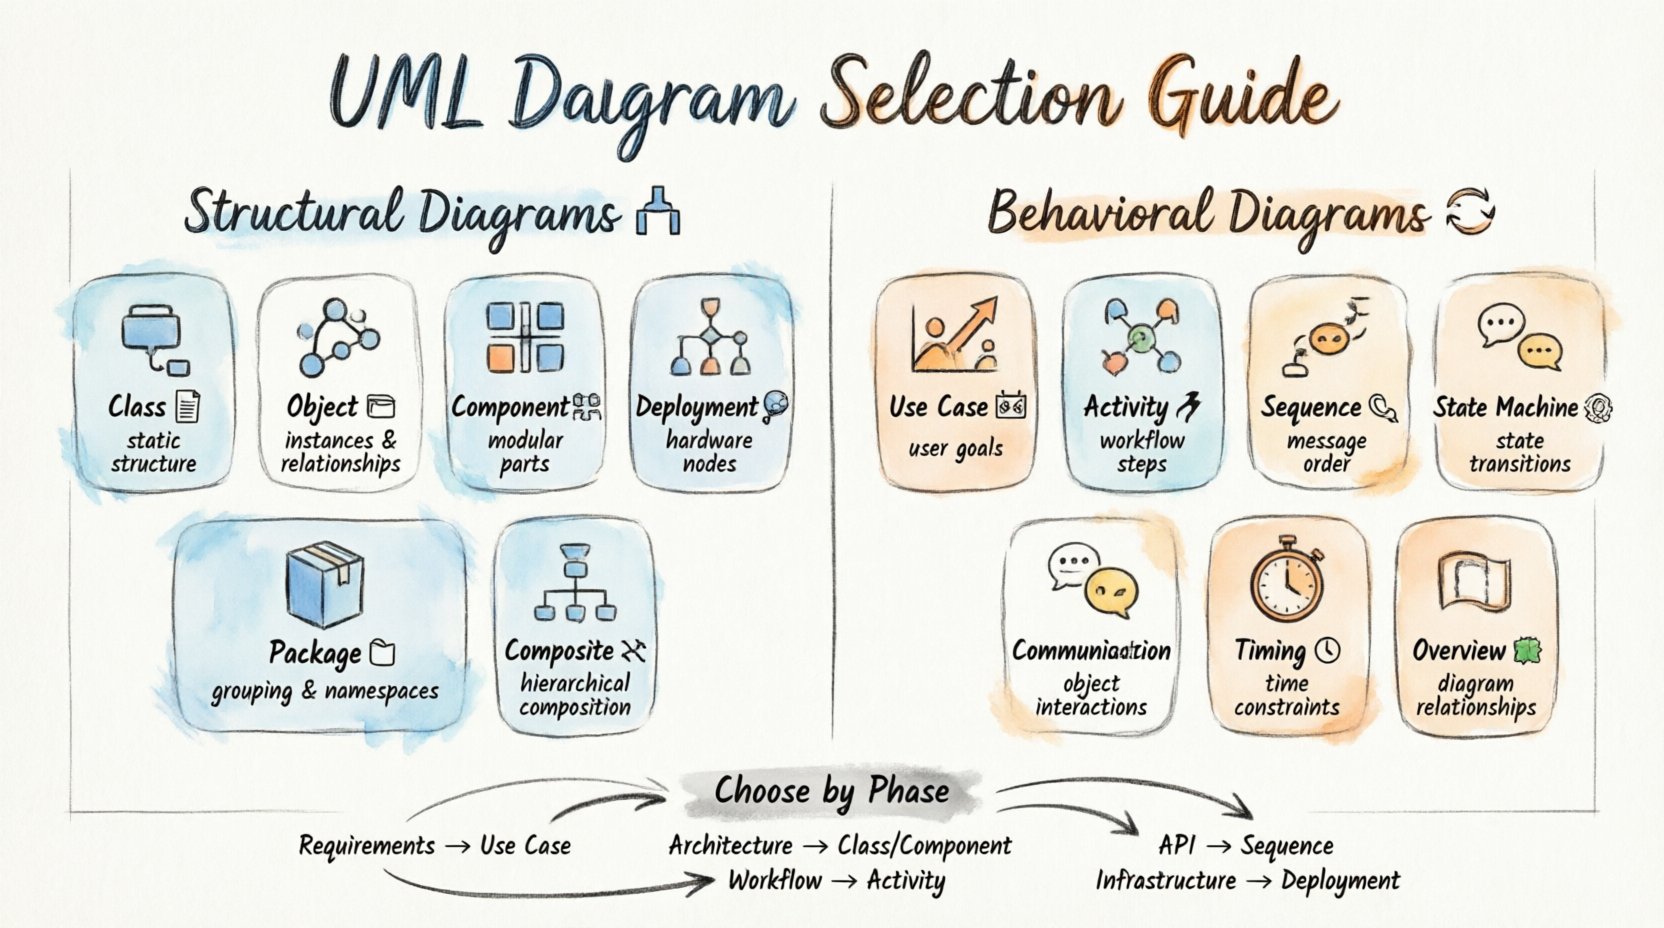
- Structural Diagrams: These depict the static aspects of the system. They show the components, relationships, and data structures that exist regardless of time or action. Think of these as the architectural blueprints of a building. 🏛️
- Behavioral Diagrams: These depict the dynamic aspects of the system. They illustrate how the system acts, reacts, and interacts over time. These are akin to the flow of people through the building or the movement of elevators. 🔄
Structural Diagrams: Defining Static Architecture 🏛️
Structural diagrams focus on the “what” of the system. They define the elements that make up the system and how they relate to one another. These are critical for database design, code structure planning, and understanding system composition.
1. Class Diagram 📋
The class diagram is the most widely used diagram in UML. It describes the structure of a system by showing the system’s classes, their attributes, operations (methods), and the relationships among objects. 🔗
- Best For: Object-oriented design, database schema planning, and documenting code structure.
- Key Elements: Classes, attributes, methods, associations, inheritance, and interfaces.
- When to Use: When you need to understand the static relationships between entities. It is the backbone of system design.
2. Object Diagram 🖼️
An object diagram represents a snapshot of the system at a specific point in time. It shows instances of classes (objects) and the links between them. 📸
- Best For: Validating class diagrams or showing a specific data state.
- Key Elements: Object instances, links between objects, and attribute values.
- When to Use: When you need to demonstrate a specific scenario or test data structure against a real-world example.
3. Component Diagram 🧩
This diagram describes the organization and relationships of software components. It groups classes into components to show the high-level structure of the system. 🧱
- Best For: System architecture, microservices design, and library dependencies.
- Key Elements: Components, interfaces, ports, and dependencies.
- When to Use: When focusing on the physical or logical organization of software modules rather than individual classes.
4. Deployment Diagram 🌐
A deployment diagram depicts the physical architecture of the system. It shows the hardware nodes and the software artifacts deployed on them. 🖥️
- Best For: Infrastructure planning, server topology, and network configuration.
- Key Elements: Nodes (servers, devices), artifacts (files, executables), and communication paths.
- When to Use: During the implementation phase to define where software runs.
5. Package Diagram 📁
Package diagrams organize elements into groups to manage complexity. They act as namespaces to keep large systems organized. 📂
- Best For: Large-scale systems where class diagrams become too cluttered.
- Key Elements: Packages, nested packages, and dependencies between packages.
- When to Use: To provide a high-level overview of system modules.
6. Composite Structure Diagram 🔗
This diagram shows the internal structure of a class or component. It details the parts, ports, and connectors within a class. 🧬
- Best For: Detailed internal design of complex classes or reusable components.
- Key Elements: Parts, ports, connectors, and roles.
- When to Use: When you need to expose the internal working mechanism of a specific component.
Behavioral Diagrams: Mapping Dynamic Flow 🔄
Behavioral diagrams focus on the “how” of the system. They capture the interactions, state changes, and processes that occur during system execution. 🏃
1. Use Case Diagram 🎬
Use case diagrams illustrate the functionality of a system from the perspective of an external user. They show actors and the goals they want to achieve. 🎯
- Best For: Requirements gathering and defining system scope.
- Key Elements: Actors, use cases, and relationships (include, extend).
- When to Use: Early in the project to align stakeholders on what the system must do.
2. Activity Diagram 🏃
Activity diagrams describe the flow of control and data within a system. They are similar to flowcharts but handle concurrency and parallelism better. 📊
- Best For: Business process modeling and algorithm design.
- Key Elements: Actions, decision points, forks, joins, and swimlanes.
- When to Use: When mapping out complex workflows or business rules.
3. State Machine Diagram ⏸️
Also known as a state diagram, this shows the states an object can be in and the transitions between them. ⏱️
- Best For: Modeling objects with complex lifecycle logic.
- Key Elements: States, transitions, events, and guards.
- When to Use: For systems like payment gateways, order processing, or user authentication flows.
4. Sequence Diagram 📞
Sequence diagrams show how objects interact with each other over time. They are time-ordered interaction diagrams. ⏳
- Best For: Designing API interactions and message passing.
- Key Elements: Lifelines, activation bars, and messages (synchronous/asynchronous).
- When to Use: When detailing the step-by-step interaction for a specific use case.
5. Communication Diagram 💬
Communication diagrams (formerly collaboration diagrams) show the same information as sequence diagrams but focus on the structural organization of objects. 📍
- Best For: Understanding the network of objects involved in a process.
- Key Elements: Objects, links, and numbered messages.
- When to Use: When the spatial relationship between objects is more important than the timing.
6. Timing Diagram ⏱️
Timing diagrams focus on the timing constraints of interactions. They show how conditions change over time. ⏲️
- Best For: Real-time systems and embedded hardware.
- Key Elements: Time scales, states, and values over time.
- When to Use: When precise timing requirements are critical to system functionality.
7. Interaction Overview Diagram 🗺️
This diagram combines activity and sequence diagrams. It provides a high-level view of the control flow, using activity nodes to represent sequence diagrams. 🧭
- Best For: Complex workflows involving multiple interactions.
- Key Elements: Activity nodes, control flow, and embedded sequence diagrams.
- When to Use: To orchestrate multiple sequence diagrams into a single process flow.
How to Select the Appropriate Diagram 🤔
Choosing the right diagram depends on the project phase, the audience, and the specific problem you are solving. Use the following matrix to guide your selection. 📋
| Project Phase | Primary Goal | Recommended Diagram |
|---|---|---|
| Requirements Gathering | Define user goals | Use Case Diagram 🎬 |
| System Architecture | Define structure | Class or Component Diagram 📋 |
| Business Process | Map workflows | Activity Diagram 🏃 |
| Object Lifecycle | Track state changes | State Machine Diagram ⏸️ |
| API/Integration | Detail message flow | Sequence Diagram 📞 |
| Infrastructure | Map hardware | Deployment Diagram 🌐 |
Consider Your Audience:
- Stakeholders: Prefer Use Case Diagrams for high-level understanding. 🗣️
- Developers: Need Class and Sequence Diagrams for implementation details. 💻
- DevOps: Require Deployment Diagrams for infrastructure setup. 🖥️
- Analysts: Benefit from Activity Diagrams for process optimization. 📈
Common Pitfalls to Avoid 🚫
Even with the right diagram type, errors in execution can undermine the value of the model. Watch out for these common issues.
- Over-Modeling: Creating diagrams for every single minor class creates noise. Focus on the core architecture. 🧹
- Inconsistency: Ensure the Sequence Diagram matches the Class Diagram. Mismatches cause confusion. 🔄
- Lack of Context: A diagram without a legend or context note can be ambiguous. Always label clearly. 🏷️
- Static Behavior: Do not try to model dynamic behavior in a Class Diagram. Keep behaviors in behavioral diagrams. 🛑
- Ignoring Updates: UML models must evolve with the code. Outdated diagrams are worse than no diagrams. 📅
Maintaining Diagram Relevance 🔄
A UML model is a living document. It requires maintenance to remain useful. Here are strategies to keep your diagrams accurate over time. 🛠️
- Version Control: Store diagrams in the same repository as your code. This ensures they are updated with every commit. 📂
- Automated Generation: Where possible, generate diagrams from code. This reduces manual effort and drift. 🤖
- Regular Reviews: Schedule diagram reviews during sprint planning. Verify they match the current state of the system. 🗓️
- Modularization: Break large diagrams into smaller, focused views. This improves readability and manageability. 🔍
- Standardization: Agree on naming conventions and notation styles across the team. Consistency aids comprehension. ✍️
Integrating Diagrams into Workflow 📝
UML should not be an afterthought. It works best when integrated into the development lifecycle from the start. 🚀
- Design First: Sketch class and sequence diagrams before writing code. This prevents architectural debt. 🏗️
- Collaborative Editing: Use shared models during team meetings. This ensures everyone understands the design intent. 🤝
- Documentation: Link diagrams to requirement documents. Traceability ensures every feature is modeled. 🔗
- Testing: Use activity diagrams to define test cases. Verify that the flow matches the specification. ✅
- Handover: Use deployment diagrams to train new team members on the infrastructure. 🎓
Conclusion on Model Selection 🏁
Selecting the correct UML diagram is not about using every available tool. It is about choosing the one that communicates the necessary information most effectively for the current context. By distinguishing between structural and behavioral needs, and aligning diagram types with project phases, teams can build systems that are both robust and maintainable. 🏆
Remember that the goal of modeling is clarity. If a diagram confuses more than it clarifies, simplify it. Prioritize the diagram that solves the specific problem at hand. With practice, selecting the right visualization becomes intuitive, leading to smoother development cycles and higher quality software. 🧠