Understanding the dynamic behavior of a system is a fundamental skill for any computer science student. While use case diagrams provide a high-level view of interactions, activity diagrams dive deeper into the logic and flow of operations. These diagrams are essential for modeling algorithms, business processes, and software workflows. Learning to read them effectively allows you to visualize complex logic before writing a single line of code.
This guide breaks down the syntax, semantics, and interpretation strategies for activity diagrams. We will explore the standard notations, common patterns, and advanced features without relying on specific tools or software. By the end of this walkthrough, you will possess the confidence to analyze diagrams found in documentation, academic papers, and design specifications.
What is an Activity Diagram? 🤔
An activity diagram is a type of behavioral diagram in the Unified Modeling Language (UML). It represents the flow of control from activity to activity. Think of it as a sophisticated flowchart that incorporates object-oriented concepts, concurrency, and state changes. Unlike a standard flowchart, which often focuses on procedural logic, an activity diagram can model parallel processing and complex decision trees.
Key characteristics include:
- Focus on Flow: It emphasizes the sequence of actions rather than the structure of objects.
- Concurrency: It can show multiple threads of activity happening simultaneously.
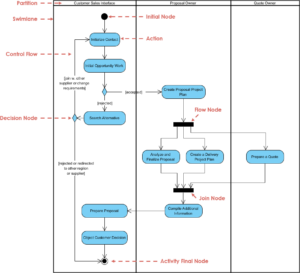
- Swimlanes: It partitions activities to show which actor or component is responsible for them.
- Object Flow: It tracks the creation and destruction of objects during the process.
For CS students, mastering this notation bridges the gap between abstract algorithmic thinking and concrete system design. It answers the question: “How does this system actually work step-by-step?”
Core Building Blocks of Activity Diagrams 🧱
Every activity diagram is constructed from a specific set of symbols. Recognizing these symbols is the first step in reading the diagram. Each symbol has a specific meaning regarding control flow.
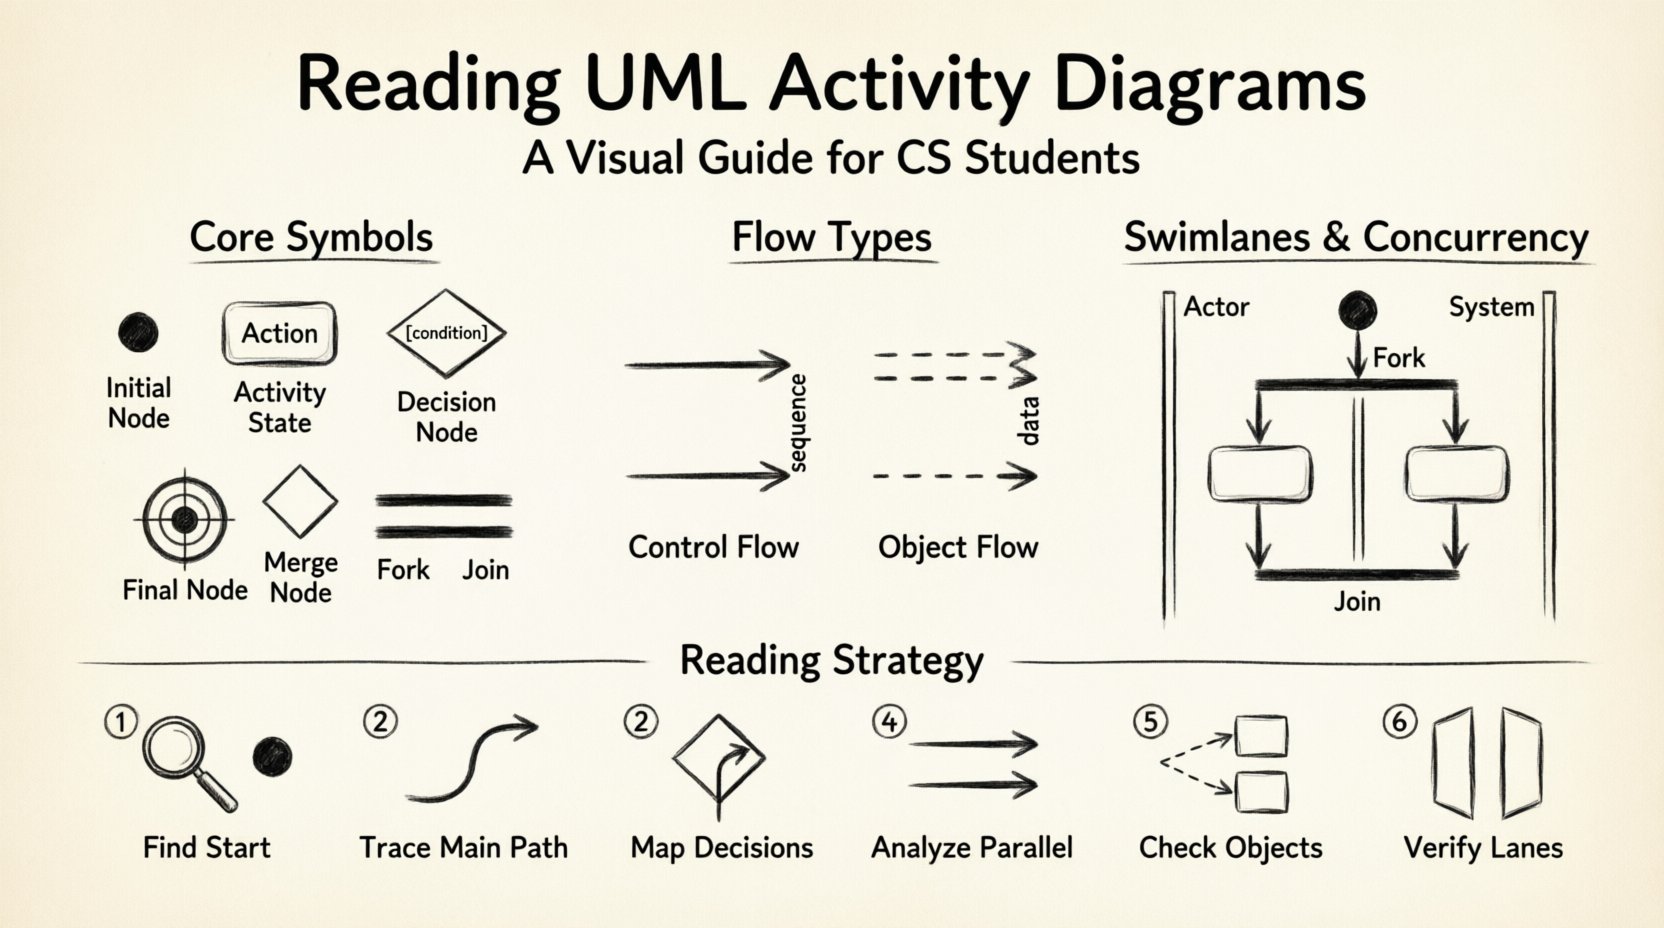
1. Initial Node (The Start) ⏺️
The initial node represents the beginning of the workflow. It is typically a filled black circle. There should only be one initial node in a single activity diagram to ensure a clear entry point. All execution paths originate here.
- Visual: Solid black circle.
- Meaning: Trigger event or system start.
- Outgoing: Exactly one outgoing flow is standard practice.
2. Activity State (The Action) ⚙️
Activity states represent the actual work being performed. They can be simple tasks like “Validate Input” or complex operations like “Process Payment.” In diagrams, these are drawn as rounded rectangles.
- Visual: Rounded rectangle with the action name inside.
- Meaning: A task that takes time to complete.
- Input/Output: Objects may flow into or out of these states.
3. Decision Node (The Fork in the Road) ➡️
Decision nodes allow the flow to branch based on conditions. They are represented by a diamond shape. From a decision node, multiple outgoing flows are possible, but only one path is taken during execution.
- Visual: Diamond shape.
- Labeling: Each outgoing line must have a guard condition (e.g., [True], [False], [Amount > 100]).
- Logic: Evaluates a boolean expression to determine the next step.
4. Merge Node (The Convergence) ⬇️
A merge node combines multiple incoming flows back into a single flow. It is visually identical to a decision node (a diamond), but its function is different. It does not make a decision; it simply accepts any path that arrives at it.
- Visual: Diamond shape.
- Meaning: Paths coming from different conditions converge here.
- Outgoing: Exactly one flow leaves the merge node.
5. Final Node (The End) ⏹️
The final node marks the completion of the activity. It is a solid black circle surrounded by a larger ring. There can be multiple final nodes if the process can end in different ways (e.g., success vs. failure).
- Visual: Black circle inside a ring.
- Meaning: Process termination.
- Incoming: Can have multiple incoming flows.
Managing Concurrency with Forks and Joins 🔄
One of the most powerful features of activity diagrams is the ability to model concurrent execution. This is crucial for understanding multi-threaded applications or systems with parallel processes.
Fork Node (Parallelism) 📌
A fork node splits a single control flow into multiple simultaneous flows. It is represented by a thick horizontal or vertical bar.
- Visual: Thick bar.
- Function: All outgoing flows are activated at the same time.
- Use Case: Starting multiple background tasks simultaneously.
Join Node (Synchronization) 🤝
A join node waits for all incoming flows to arrive before proceeding. It ensures that parallel tasks are synchronized before continuing.
- Visual: Thick bar.
- Function: Blocks until all incoming paths are complete.
- Use Case: Waiting for data from multiple sources before rendering.
Understanding the difference between a Decision/Merge and a Fork/Join is critical. Decision nodes select one path; Fork nodes activate all paths. Merge nodes accept any path; Join nodes wait for all paths.
Organizing Complexity with Swimlanes 🏊
As systems grow, a single diagram can become cluttered. Swimlanes provide a way to partition the diagram based on responsibility. Each lane represents a specific actor, department, or system component.
| Swimlane Type | Responsibility | Example |
|---|---|---|
| Actor Lane | User or Human | Customer, Administrator |
| System Lane | Software Component | Database, API Server |
| Process Lane | Specific Workflow | Order Processing, Billing |
When reading a diagram with swimlanes:
- Trace Vertically: Look for actions within a specific lane to understand what that actor does.
- Trace Horizontally: Look for flows crossing lanes to understand interactions between actors.
- Identify Handoffs: Points where a flow crosses from one lane to another indicate a handoff of responsibility.
Swimlanes reduce cognitive load by grouping related activities. They make it clear who is responsible for each step in the process.
Control Flow vs. Object Flow 📦
Activity diagrams handle two types of flows. Distinguishing between them is vital for accurate interpretation.
Control Flow
Control flow represents the order of execution. It determines which action happens next. In the diagram, this is shown as a solid line with an arrowhead.
- Direction: Indicates sequence.
- Dependency: Action B starts after Action A finishes.
Object Flow
Object flow represents the movement of data or objects. Objects are created, modified, or destroyed as the process moves. This is shown as a dashed line with an arrowhead.
- Direction: Indicates data transfer.
- Dependency: Action B requires the output of Action A.
When analyzing a diagram, ask: “Is this line controlling the timing, or is it moving data?” Misinterpreting an object flow as a control flow can lead to design errors where logic assumes data exists before it is created.
Guard Conditions and Timing ⏱️
Not all decisions are binary. Guard conditions allow for more nuanced logic. These are enclosed in square brackets on the outgoing flow from a decision node.
Example: A flow might have a guard condition like [User Logged In] or [Balance > 0].
- Guard Clauses: Ensure specific conditions are met before proceeding.
- Timeouts: Some diagrams include time-based triggers, indicating a process should stop or change state after a specific duration.
- Exception Handling: Flows can be labeled to indicate error paths (e.g., [Error: Network Failure]).
Reading these conditions requires attention to detail. If multiple outgoing flows from a decision node do not cover all possibilities, the diagram may represent an incomplete logic set.
Strategies for Reading Complex Diagrams 🧐
When faced with a large, complex activity diagram, a systematic approach prevents confusion. Follow these steps to analyze the diagram effectively.
- Identify the Entry Point: Locate the initial node. Ensure there is a clear starting point.
- Trace the Main Path: Follow the primary flow from start to finish without worrying about branches yet. This gives you the happy path.
- Map the Decision Points: Identify all decision nodes. List the possible outcomes for each.
- Analyze Parallel Sections: Locate fork and join nodes. Determine if the parallel processes are independent or dependent.
- Check Object Flow: Trace the movement of data objects. Ensure they are created before they are used.
- Verify Swimlanes: Ensure every action is assigned to a responsible lane. Look for orphaned actions.
This methodical walkthrough ensures you do not miss critical logic paths or synchronization points.
Common Pitfalls in Activity Diagrams 🚫
Even experienced designers make mistakes. Being aware of common errors helps you spot them quickly in documentation.
- Dead Ends: Flows that lead to nowhere without a final node. This indicates logic that terminates unexpectedly.
- Infinite Loops: Cycles that have no exit condition. While valid in some contexts (e.g., polling), they often indicate a bug in the design.
- Confusing Merge and Join: Using a merge node where a join is needed can imply parallel tasks are not synchronized, leading to race conditions.
- Missing Guard Conditions: Decision nodes without labels on all outgoing paths create ambiguity about which path is taken.
- Overlapping Swimlanes: If an activity appears in multiple lanes without a clear handoff, it suggests unclear responsibility.
Interpreting Pre-Conditions and Post-Conditions 📝
Advanced activity diagrams often include constraints. These are textual notes attached to specific nodes or flows.
- Pre-Conditions: Requirements that must be met before an activity can start. (e.g., “User must be authenticated”).
- Post-Conditions: Guarantees that are true after an activity completes. (e.g., “Database record updated”).
These notes act as assertions. When reading the diagram, verify if the previous step satisfies the pre-condition for the next step. This validates the integrity of the workflow.
Application in Software Engineering 🛠️
Activity diagrams are not just academic exercises. They serve practical purposes in the software development lifecycle.
- Requirement Analysis: Helps stakeholders visualize the process flow before development begins.
- Design Documentation: Serves as a blueprint for developers implementing the logic.
- Testing Scenarios: Test cases can be derived directly from the paths identified in the diagram.
- Communication: Provides a visual language to bridge the gap between technical and non-technical team members.
For a CS student, understanding this utility demonstrates that diagrams are tools for clarity, not just compliance.
Final Considerations for Students 💡
Reading activity diagrams is a skill that improves with practice. Start with simple diagrams and gradually move to complex ones involving concurrency and multiple swimlanes. Always look for the flow of control and the flow of data. Ensure every path leads to an end state. Check that responsibilities are clearly assigned.
Remember that a diagram is a representation of reality, not reality itself. Ambiguities in the diagram often reflect ambiguities in the requirements. If a diagram is unclear, it is a signal to ask questions rather than assume intent.
By mastering the syntax and logic of activity diagrams, you gain a powerful tool for system design. You will be able to deconstruct complex systems, identify logical flaws, and communicate your own designs with precision. This capability is highly valued in software engineering roles and academic projects alike.
Keep these principles in mind as you study and practice. The ability to visualize logic is the foundation of robust software architecture.