In the landscape of software architecture and system design, visualizing how components interact is as critical as the code itself. A communication diagram provides a clear view of the relationships between objects and the flow of messages that drive behavior within a system. Unlike other modeling tools that prioritize time, this specific diagram type focuses on the structural organization of objects and their connections. This guide details the process of creating effective diagrams from the ground up, ensuring clarity for developers, stakeholders, and maintainers.
Understanding the Core Purpose 🎯
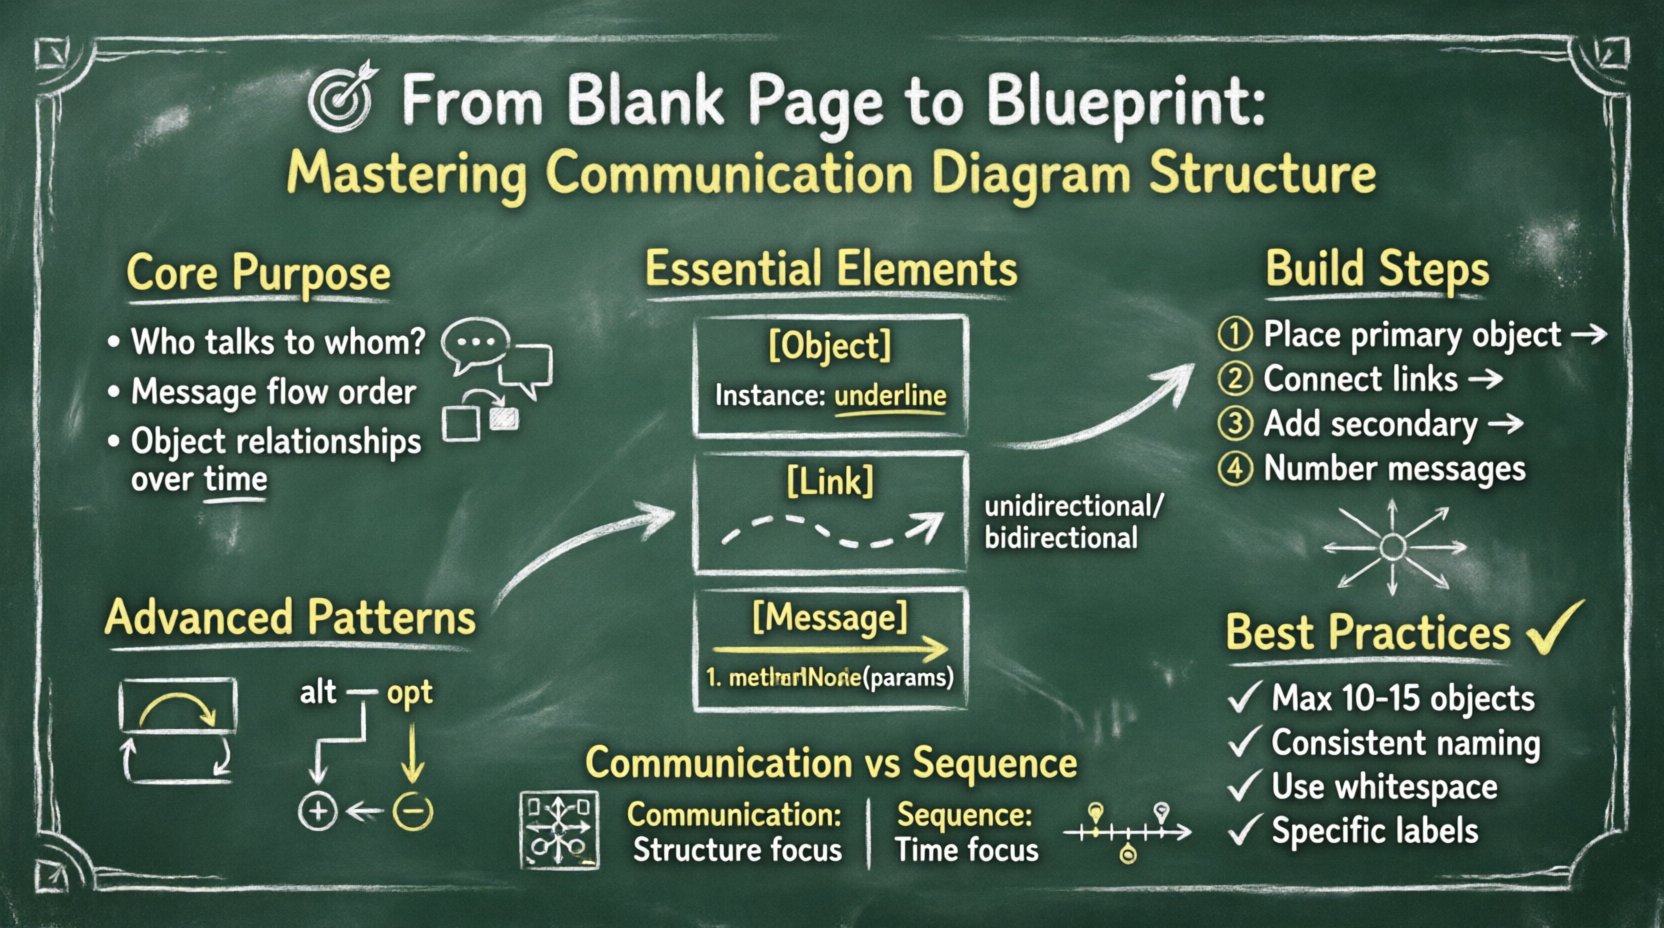
A communication diagram serves as a dynamic representation of the static structure of a system. It bridges the gap between abstract requirements and concrete implementation. When designing complex applications, understanding who talks to whom is essential. This diagram type answers specific questions regarding:
- Which objects initiate communication?
- Which objects receive requests?
- How many times does a message pass between specific nodes?
- What is the order of operations?
While it shares similarities with sequence diagrams, the primary distinction lies in the emphasis. Communication diagrams prioritize the structural links between objects over the strict chronological timeline. This makes them particularly useful for understanding the architecture of a system without getting bogged down in the minutiae of timing.
Essential Elements of the Diagram 🧩
To construct a valid diagram, one must understand the fundamental building blocks. Every visual element carries specific semantic meaning. Deviating from standard conventions can lead to confusion and misinterpretation of the system logic.
1. Objects and Instances
Objects represent the active entities within the system. They are typically depicted as rectangles containing the class name or a specific instance name. When modeling a specific scenario, instances are often shown with an underline to distinguish them from general class definitions. Key characteristics include:
- Identity: Each object must have a unique identifier within the context of the diagram.
- Responsibility: Objects are responsible for specific tasks or data storage.
- State: While the diagram focuses on interaction, the internal state changes are implied by incoming and outgoing messages.
2. Links
Links represent the connections between objects. They indicate that one object knows about another and can send messages to it. These are the pathways through which information flows. A link does not imply a constant physical connection but rather a logical association. Important considerations for links include:
- Direction: Links can be unidirectional or bidirectional.
- Multiplicity: A single object may connect to multiple instances of another class.
- Visibility: The link implies that the target object is accessible to the source object.
3. Messages
Messages are the actions taken by one object upon another. They are the verbs of the diagram. Each message represents a specific operation or method call. Messages are labeled with a sequence number to establish order. The text of the message should be concise and descriptive. Key attributes of messages include:
- Sequence Number: A number (1, 2, 3…) indicating the order of execution.
- Label: The name of the operation or method.
- Parameters: Data passed along with the message, if applicable.
Preparing the Blueprint 📝
Before drawing lines or placing boxes, a thorough preparation phase is necessary. Rushing into the visual creation without a plan often results in cluttered and unreadable diagrams. This phase ensures that the final output accurately reflects the system’s logic.
Defining the Scope
Every diagram should have a defined boundary. Attempting to model the entire system in a single view is a common mistake that leads to information overload. Instead, break the system down into logical modules or use cases. Ask yourself:
- What specific scenario am I modeling?
- Which objects are essential to this specific flow?
- What is the starting point of the interaction?
Identifying Actors and Systems
Clearly distinguish between external actors and internal system components. External actors are typically users or other systems interacting with the application. Internal components are the software objects handling the logic. Visual separation helps in understanding the perimeter of the system.
Mapping the Data Flow
Before drawing links, list the data required for the interaction. Knowing what data moves between objects helps determine the necessary connections. This step prevents the creation of links that serve no functional purpose in the current context.
Building the Structure Step-by-Step 🏗️
Constructing the diagram requires a methodical approach. Follow these steps to ensure a logical layout and clear communication of intent.
Step 1: Place the Primary Object
Begin by placing the object that initiates the interaction or the central object around which the scenario revolves. Positioning this object in the center or at the top provides a natural focal point for the reader.
Step 2: Connect Related Objects
Draw links between the primary object and the objects it directly interacts with. Ensure that the links are straight or have minimal bends to maintain readability. Avoid crossing lines where possible, as this creates visual noise.
Step 3: Add Secondary Objects
Expand the diagram by adding objects that are called by the primary objects. Maintain a logical flow, moving from the initiator outward to the peripheral components. This radial or hierarchical layout helps in understanding the depth of the interaction.
Step 4: Number and Label Messages
Assign sequence numbers to every message. Start with 1 for the first action. If a message triggers a response, number it sequentially (e.g., 1, 1.1, 1.2). This nested numbering system clarifies the depth of the call stack without needing a strict timeline.
Advanced Messaging Patterns 🔄
Real-world systems involve complex interactions that go beyond simple request-response pairs. Understanding advanced patterns allows for accurate modeling of loops, conditionals, and recursion.
Loops and Iterations
When an object sends a message repeatedly to another, this is represented as a loop. This is common in data processing where a list of items is iterated over. The message is enclosed in a box labeled „loop“ or „iterate“. This indicates that the action occurs multiple times until a condition is met.
Conditional Logic
Systems often branch based on specific criteria. This is shown using „alt“ or „opt“ frames. The „alt“ frame represents an alternative path, where one path is taken if a condition is true, and another if false. The „opt“ frame represents an optional path. These frames help in documenting decision points within the interaction flow.
Creation and Destruction
Objects are not static; they are created and destroyed during runtime. A message can trigger the creation of a new object instance. This is often denoted by a specific symbol or notation at the start of the message. Similarly, the destruction of an object can be marked when it is no longer needed. This ensures the lifecycle of objects is visible within the interaction.
Communication vs. Sequence Diagrams 📊
Choosing the right tool is vital for effective documentation. While both diagram types model interaction, they serve different purposes. The following table outlines the key differences.
| Feature | Communication Diagram | Sequence Diagram |
|---|---|---|
| Focus | Structural relationships between objects. | Time-based order of messages. |
| Layout | Radial or network-based layout. | Linear vertical timeline. |
| Best For | Understanding object navigation and links. | Understanding the sequence of events. |
| Complexity | Can become cluttered with many links. | Can become long with many messages. |
| Readability | Good for high-level architectural views. | Good for detailed algorithmic flows. |
When the goal is to show how objects are connected and how they find each other, the communication diagram is often superior. When the goal is to debug timing issues or understand the exact order of execution, the sequence diagram is preferred.
Best Practices for Clarity ✅
A diagram is useless if it cannot be understood quickly. Adhering to established conventions improves the maintainability of the documentation.
- Limit Complexity: Avoid placing more than 10 to 15 objects on a single diagram. If the system is larger, split the diagram into sub-diagrams based on functionality.
- Consistent Naming: Use consistent naming conventions for objects and messages. If an object is called „User“ in one place, do not call it „Client“ in another.
- Color Usage: If using color, apply it consistently to denote specific types of objects (e.g., external actors vs. internal classes). Avoid using color merely for decoration.
- Whitespace: Leave adequate space between elements. Crowded diagrams are difficult to read and modify.
- Contextual Notes: Use text notes to explain complex logic that cannot be represented by standard symbols. Place these notes near the relevant objects.
Common Pitfalls to Avoid ⚠️
Even experienced modelers can make mistakes that reduce the value of the diagram. Being aware of common errors helps in producing higher quality outputs.
1. Overloading the Diagram
Attempting to show every possible interaction in one view is a frequent error. This leads to a „spaghetti“ diagram where lines cross over each other. Focus on the primary flow and document edge cases in separate diagrams.
2. Ignoring Return Messages
While often optional, return messages are crucial for understanding data flow back to the initiator. In complex systems, omitting returns can hide where data is transformed or validated.
3. Inconsistent Link Direction
Ensure that link directions match the message flow. If Object A sends a message to Object B, the link should clearly indicate that A knows about B. Mixing bidirectional and unidirectional links without reason creates confusion.
4. Vague Message Labels
Avoid generic labels like „Process“ or „Handle“. Be specific. Use „ValidateUserCredentials“ instead of „Check User“. Specificity aids in mapping the diagram back to the codebase.
Integrating with System Design 🌐
Communication diagrams are not isolated artifacts. They should integrate with the broader system design documentation. This ensures that the interaction model aligns with the structural and behavioral models.
Alignment with Class Diagrams
The objects used in the communication diagram must exist in the class diagram. If an object appears in the interaction model but not in the structural model, there is a discrepancy that needs resolution. This alignment ensures that the interaction is technically feasible.
Alignment with Use Case Models
Each communication diagram should correspond to a specific use case or user story. This traceability helps in verifying that all requirements are met by the system design. If a use case is not represented in any interaction diagram, it may be incomplete.
Review and Validation 🔍
Once the diagram is complete, a review process is essential. This step validates the accuracy and completeness of the model.
- Walkthrough: Trace the path of a message from start to finish. Does it make logical sense?
- Stakeholder Feedback: Have developers or business analysts review the diagram. They may spot missing steps or incorrect assumptions.
- Consistency Check: Ensure that the diagram follows the naming and formatting standards established for the project.
Validation is an iterative process. As the system evolves, the diagram must be updated to reflect the changes. A static diagram quickly becomes obsolete and loses its value as a communication tool.
Final Thoughts on Effective Modeling 🚀
Creating a communication diagram is an exercise in clarity and precision. It requires a deep understanding of the system’s architecture and the relationships between its components. By focusing on the structural links and the flow of messages, these diagrams provide a unique perspective that complements other modeling techniques.
The goal is not to create a perfect drawing, but to facilitate understanding. When developers look at the blueprint, they should immediately grasp how the pieces fit together and how data moves through the system. This shared understanding reduces errors, speeds up development, and simplifies maintenance.
Remember that tools are aids, but the thinking behind the diagram is what matters most. Take the time to plan, structure, and refine the model. A well-constructed diagram is a valuable asset to any software project, serving as a reference point for years to come.
Key Takeaways 📌
- Focus on Structure: Prioritize object relationships over strict timing.
- Number Messages: Use sequence numbers to define order clearly.
- Manage Complexity: Split large interactions into smaller, manageable diagrams.
- Validate Regularly: Ensure the diagram matches the actual code and requirements.
- Use Standard Notation: Adhere to established UML conventions for consistency.
By following these guidelines, you can transform a blank page into a robust blueprint that effectively communicates the architecture of your system. The effort invested in high-quality modeling pays dividends in reduced technical debt and improved team collaboration.