In the landscape of software architecture, visualizing how components talk to one another is critical for maintaining system integrity. While sequence diagrams often take the spotlight, Communication Diagrams offer a distinct perspective focused on the structural relationships between objects. This guide explores a practical application of these diagrams, breaking down complex interactions within a distributed system without relying on specific proprietary tools.
By examining a real-world scenario, we can understand how these diagrams clarify the flow of information, identify bottlenecks, and ensure that the underlying design supports scalability. Whether you are refining an existing system or designing a new microservice, mastering the visual representation of links and messages is essential for effective documentation.
Understanding Communication Diagrams 🧩
Communication diagrams, formerly known as collaboration diagrams, belong to the Unified Modeling Language (UML) family. They depict the interactions between objects in a system, emphasizing the organizational structure of those objects rather than the precise timing of messages.
Core Components
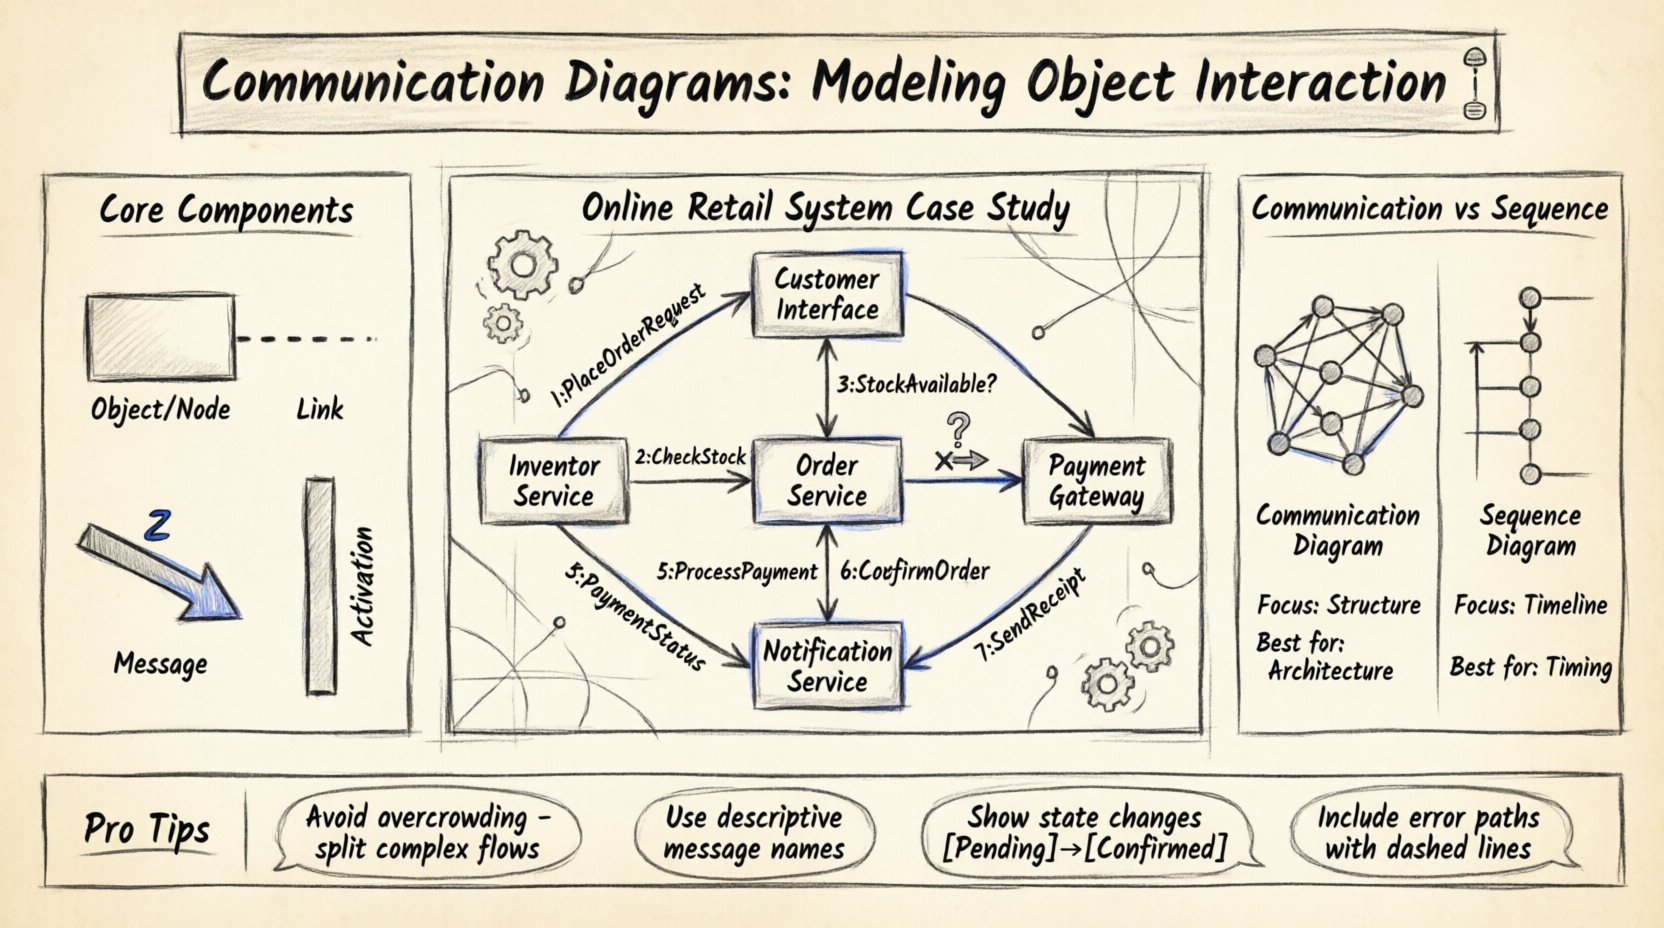
To build an effective diagram, you must understand the fundamental elements involved:
- Objects/Nodes: Represent instances of classes or components within the system. They are often labeled with the class name and a unique instance identifier.
- Links: Lines connecting objects that represent the association or relationship. These are the pathways through which messages travel.
- Messages: Arrows indicating the flow of data or control. They include a sequence number to denote order of execution.
- Activation Bars: Rectangles on objects showing the period during which an object is performing an action.
Unlike sequence diagrams, which prioritize the timeline of events, communication diagrams prioritize the topology. This makes them particularly useful for understanding how many objects are involved in a specific operation and how they are connected structurally.
The Scenario: Online Retail System 🛒
To demonstrate the utility of these diagrams, consider a standard e-commerce platform handling a customer checkout process. The system involves multiple distinct modules that must coordinate to fulfill an order.
System Boundaries
The following components participate in the interaction:
- Customer Interface: The frontend application the user interacts with.
- Order Service: The backend module responsible for managing order creation and state.
- Inventory Service: Handles stock levels and product availability.
- Payment Gateway: External system processing financial transactions.
- Notification Service: Manages email and SMS confirmations.
Primary Goal
The objective is to model the interaction flow when a customer places an order. This process requires verifying stock, charging a card, confirming the order, and sending a receipt. A clear model helps developers anticipate failure points, such as payment declines or inventory shortages.
Building the Diagram: Step-by-Step 🛠️
Creating a communication diagram involves identifying the participants and mapping the connections before drawing the arrows. This section outlines the logical steps to construct the model.
Step 1: Identify Participants
Begin by listing every object that plays a role in the specific use case. In our retail scenario, the Customer Interface initiates the process. It does not act alone; it relies on the Order Service to validate the request.
- Start with the initiator. In this case, the user action triggers the interface.
- Identify the primary receiver. The Order Service receives the initial request.
- Identify secondary dependencies. The Order Service needs to talk to Inventory and Payment.
Step 2: Define Links
Draw the lines representing associations. This establishes the “map” of the system.
- Link the Customer Interface to the Order Service.
- Link the Order Service to the Inventory Service.
- Link the Order Service to the Payment Gateway.
- Link the Order Service to the Notification Service.
Note that the Customer Interface does not directly talk to the Payment Gateway. All traffic routes through the Order Service to maintain security and business logic encapsulation.
Step 3: Assign Messages
Now, populate the links with numbered messages. The number indicates the order of execution, not necessarily the time duration.
- 1: PlaceOrderRequest (Interface → Order Service)
- 2: CheckStock (Order Service → Inventory Service)
- 3: StockAvailable? (Inventory Service → Order Service)
- 4: ProcessPayment (Order Service → Payment Gateway)
- 5: PaymentStatus (Payment Gateway → Order Service)
- 6: ConfirmOrder (Order Service → Inventory Service)
- 7: SendReceipt (Order Service → Notification Service)
Each message should be descriptive. Avoid vague labels like “send data.” Instead, use action-oriented names like ProcessPayment or CheckStock.
Analyzing the Flow 🔄
Once the diagram is drawn, the real work begins: analysis. This is where you validate the logic and check for consistency.
Sequence vs. Structure
Notice that the diagram shows a branching path. If stock is unavailable, the Order Service must stop the payment process. Communication diagrams can represent this using alternative paths or conditional messages.
- Success Path: Stock is available → Payment succeeds → Order confirmed.
- Failure Path: Stock is unavailable → Return error → Cancel request.
When modeling the failure path, ensure the message numbers reflect the rollback or cancellation steps. For example, a message labeled 8: CancelTransaction might be sent back to the Payment Gateway if the order is rejected due to stock issues.
Activation Bars
Adding activation bars helps visualize how long an object is busy. For instance, the Payment Gateway might hold a lock on the transaction for several seconds while verifying funds. This visual cue helps developers identify potential latency issues.
- Long activation bars on the Payment Gateway suggest network latency or external dependency delays.
- Short activation bars on the Notification Service suggest a lightweight task.
Communication Diagram vs. Sequence Diagram 📋
Choosing between diagram types depends on what you need to communicate. The table below compares their strengths and weaknesses in the context of system modeling.
| Feature | Communication Diagram | Sequence Diagram |
|---|---|---|
| Focus | Structural relationships and object topology. | Timeline and chronological order of messages. |
| Readability | Good for complex interactions with many objects. | Good for linear processes and timing analysis. |
| Layout | Flexible; objects can be arranged spatially. | Fixed vertical timeline; objects on horizontal axis. |
| Complexity | Can become messy with too many loops. | Can become long and vertical for complex flows. |
| Best Use Case | Understanding system architecture and connections. | Understanding specific algorithm logic or timing. |
Common Modeling Challenges ⚠️
Even experienced architects face hurdles when creating these diagrams. Recognizing common pitfalls prevents confusion later in the development phase.
1. Overcrowding the Diagram
A single diagram should not attempt to model the entire system. If the diagram becomes too dense, it loses its value as a communication tool.
- Solution: Break the system into logical contexts. Create one diagram for the Checkout process and another for the User Authentication process.
- Solution: Use composite diagrams where a complex sub-process is summarized as a single message.
2. Ambiguous Message Labels
Labels like “Get Info” are too vague. They do not specify the data type or the expected response.
- Solution: Use domain-specific terminology. Instead of “Get Info,” use FetchCustomerProfile.
- Solution: Include return values in the label if they are critical, e.g., Return OrderID.
3. Ignoring State Changes
Objects change state as messages are received. A diagram that ignores this may imply an object can handle infinite requests without resetting.
- Solution: Note state transitions in the object labels, such as Order [Pending] or Order [Confirmed].
- Solution: Document the state requirements for each message in the accompanying text.
4. Missing Error Handling
Real-world systems fail. A diagram showing only the happy path is incomplete.
- Solution: Include dashed lines or separate branches for error messages (e.g., TimeoutException or InsufficientFunds).
- Solution: Specify which component is responsible for handling the error (e.g., does the Order Service retry, or does it notify the user immediately?).
Optimization Strategies 🚀
Once the model is stable, consider how to optimize the interactions for performance and maintainability.
Reducing Hop Counts
Every arrow represents a network call or method invocation. Reducing the number of hops can improve latency.
- Check if the Inventory Service can provide shipping estimates directly to the Interface, bypassing the Order Service.
- Consolidate notification tasks. Instead of the Order Service calling the Notification Service separately for email and SMS, call a single aggregate method.
Asynchronous Messaging
Not all messages require an immediate response. In high-volume systems, asynchronous communication is preferred.
- Use fire-and-forget messages for logging or non-critical updates.
- Mark asynchronous messages distinctly (e.g., using a different arrowhead style or label).
- This changes the activation bars, as the sender does not wait for the receiver to complete the action.
Decoupling Services
Hard links between objects make the system brittle. If the Payment Gateway changes its interface, the Order Service breaks.
- Introduce an abstraction layer, such as an API Gateway, between the Order Service and external systems.
- Model the abstraction layer as a distinct object in the diagram to show the decoupling point.
Integrating into Development Lifecycle 🔗
These diagrams are not just documentation artifacts; they are living tools used throughout the software lifecycle.
Design Phase
During the design phase, the diagram serves as a blueprint. Developers review it to understand dependencies before writing code. It helps identify circular dependencies, where Object A calls Object B, and Object B calls Object A, which can lead to stack overflow errors.
Testing Phase
Testers use the diagram to generate test cases. If the diagram shows a message flow from Interface to Service, a corresponding integration test should verify that connection.
- Unit Tests: Verify the logic within a single object.
- Integration Tests: Verify the interaction between two objects as shown in the diagram.
- End-to-End Tests: Verify the full flow from Interface to Notification Service.
Maintenance Phase
When a feature is added, the diagram must be updated. If the diagram lags behind the code, it becomes misleading. This is known as “documentation drift.”
- Strategy: Treat the diagram as code. Store it in the version control system alongside the source code.
- Strategy: Require diagram updates as part of the pull request review process.
Future Proofing the Model 📈
Systems evolve. What works today may not work tomorrow. Modeling with communication diagrams allows you to visualize future changes before they happen.
Scalability Considerations
If the Order Service needs to handle 10x the traffic, does the diagram change? You might add load balancers or cache layers.
- Visualize where new objects will enter the flow.
- Ensure the links can handle increased message volume.
Security Updates
Security protocols change. Encryption standards update. The diagram should reflect where security checks occur.
- Add a Security Validator object if a new middleware layer is introduced.
- Mark sensitive messages (like PaymentDetails) with a lock icon or specific color coding to highlight security boundaries.
Final Thoughts on Visual Modeling 💡
Creating a communication diagram is an exercise in clarity. It forces you to articulate exactly how parts of a system depend on one another. By focusing on the structure rather than just the timeline, you gain insights into the stability and modularity of your architecture.
Through the case study of the online retail system, we saw how breaking down a process into objects, links, and messages reveals hidden complexities. Whether you are troubleshooting a legacy system or planning a greenfield project, these diagrams provide a common language for teams to discuss design decisions.
Remember that the goal is not perfection in the drawing, but clarity in the understanding. Regularly review your models against the actual code to ensure they remain accurate. As the system grows, the diagrams grow with it, serving as a reliable map for anyone navigating the codebase.