
In modern software development, complexity is the only constant. As systems grow in size and functionality, the interactions between components become increasingly intricate. Teams often struggle to visualize these relationships, leading to miscommunication, architectural drift, and inefficient debugging processes. This is where Unified Modeling Language (UML) Collaboration Diagrams, often referred to as Communication Diagrams in newer standards, prove essential. They offer a structured way to map out how objects interact within a system, translating abstract logic into a visual language that developers, testers, and stakeholders can understand.
Visualizing logic is not just about drawing pictures; it is about creating a shared mental model. When a team can see the flow of data and control, they can identify bottlenecks, circular dependencies, and potential failures before a single line of code is written. This guide explores the mechanics of these diagrams, their practical application, and how they foster better collaboration across technical and non-technical roles.
Understanding the Core Concept 🛠️
A Collaboration Diagram focuses on the interaction between objects. Unlike other diagram types that emphasize time sequences, this format prioritizes the structural relationships and the flow of messages between specific entities. It answers the question: “Who talks to whom, and what do they say?”
When teams approach a new feature or a complex subsystem, they often face a wall of text in requirements documents. A diagram cuts through this noise. It provides a snapshot of the runtime environment. By focusing on objects and their links, it highlights the dependencies that define the system’s behavior.
Key Components of the Diagram 📋
To build a meaningful diagram, one must understand the fundamental building blocks. These elements work together to depict the system’s state and behavior.
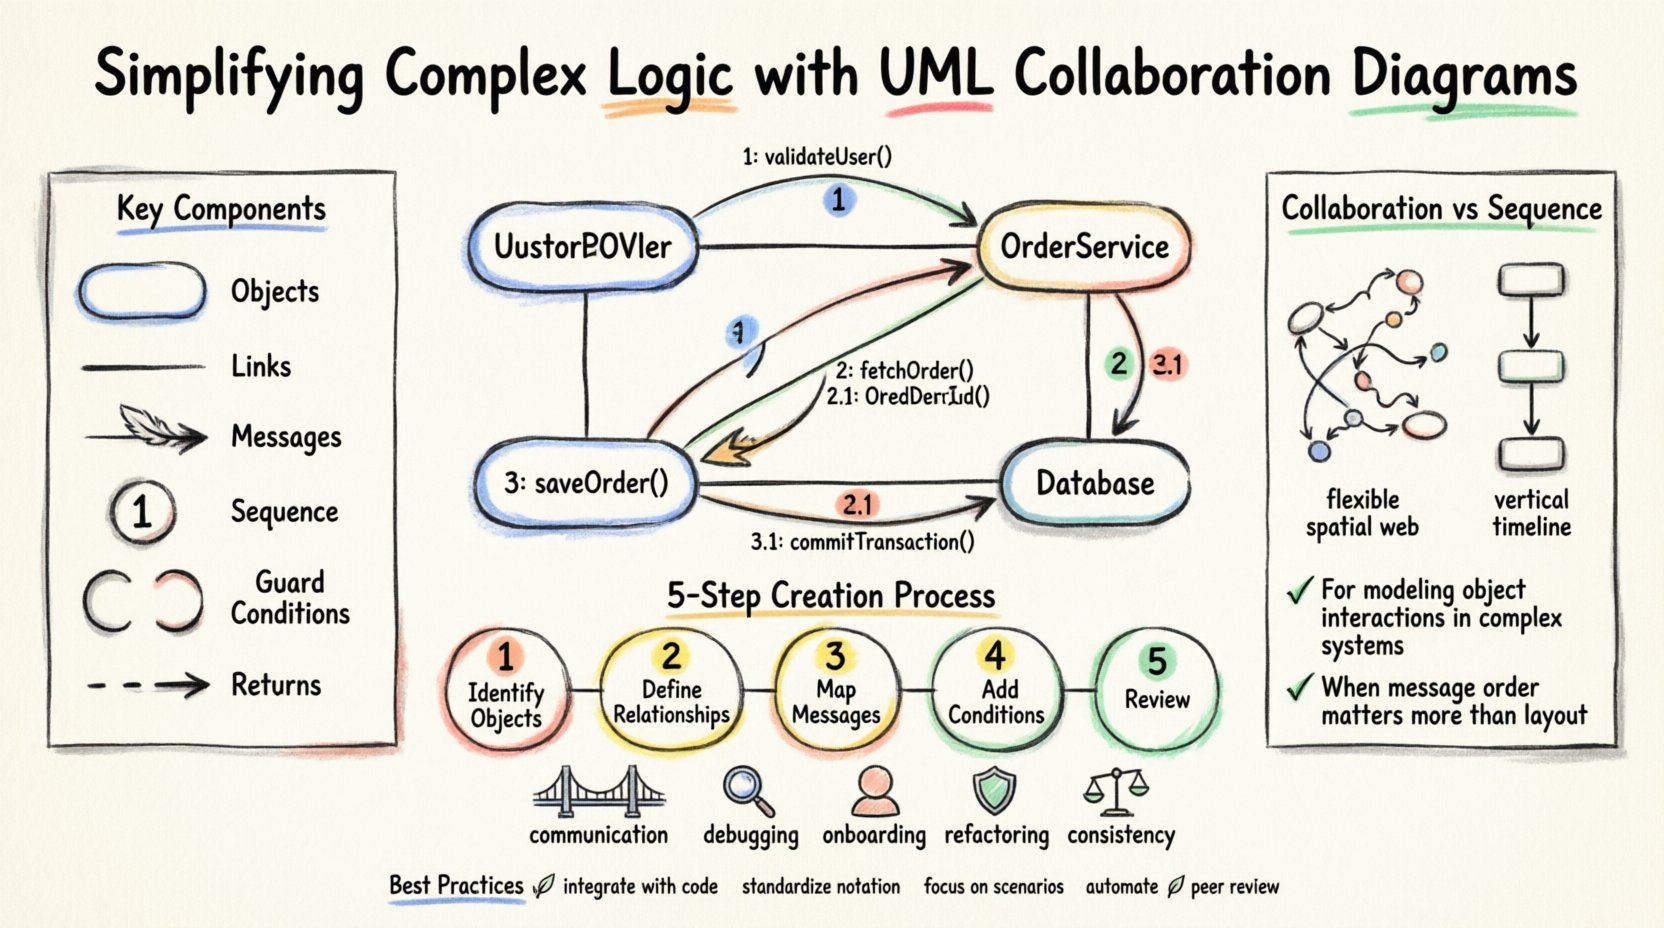
- Objects and Instances: Represented as rectangles, these denote the specific entities participating in the interaction. An object might be a class instance, such as a
UserControlleror aDatabaseConnection. - Links: These are the solid lines connecting objects. They represent the structural relationships, such as associations or aggregations, that allow objects to find one another.
- Messages: Shown as arrows, messages indicate the flow of information. They carry the method calls or signals sent from one object to another.
- Message Numbers: To indicate the sequence of events, messages are often numbered (1, 1.1, 2, etc.). This helps readers understand the order of execution without relying on vertical positioning.
- Guard Conditions: Sometimes a message is only sent if a specific condition is met. These are enclosed in square brackets, like [user is authenticated], ensuring the logic is precise.
- Return Messages: While not always mandatory, dashed lines often indicate a return value or response from the recipient back to the sender.
Collaboration vs. Sequence Diagrams ⚖️
Choosing the right tool for the job is critical. Both Collaboration and Sequence diagrams depict interactions, but they serve different cognitive purposes. A Sequence Diagram is excellent for showing the chronological order of events over time. A Collaboration Diagram is better for showing the structural organization of the objects involved.
Consider the following comparison to understand when to apply each:
| Feature | Collaboration Diagram | Sequence Diagram |
|---|---|---|
| Primary Focus | Object relationships and topology | Time and sequence of messages |
| Visual Layout | Flexible, spatial arrangement | Vertical time axis |
| Best For | Understanding complex object networks | Understanding execution flow |
| Readability | High for structural context | High for chronological context |
When a team needs to understand how a specific module is connected to the broader ecosystem, the Collaboration Diagram excels. It reveals the web of dependencies that might be hidden in a linear sequence.
Constructing the Diagram: A Step-by-Step Approach 📝
Creating these diagrams requires discipline and a clear understanding of the system requirements. Follow this logical progression to ensure accuracy and clarity.
1. Identify the Actors and Objects
Start by listing the entities involved in the scenario. This includes external users, system components, and internal services. Avoid including every single class in the system; focus only on those relevant to the specific interaction being modeled.
2. Define the Relationships
Draw the links between the identified objects. Ensure that the links represent actual associations in the codebase. If Object A does not hold a reference to Object B, do not draw a line between them. This maintains the integrity of the architectural model.
3. Map the Message Flow
Number the messages to establish the order of execution. Use clear, descriptive names for the messages, such as fetchData() or processPayment(). If a message triggers a sub-process, use nested numbering like 1.1 or 1.2.
4. Add Guard Conditions and Multiplicity
Specify any constraints. If a message is conditional, add the guard condition. Indicate multiplicity on the links if an object interacts with multiple instances of another object (e.g., 1 to *).
5. Review and Validate
Walk through the diagram with the team. Does the flow make sense? Are there missing steps? Is the return path clear? Validation ensures the model matches the intended behavior.
Why Teams Benefit from This Approach 🤝
The value of these diagrams extends beyond the initial design phase. They serve as living documentation and communication tools throughout the software lifecycle.
- Bridging the Gap: They allow business analysts to understand technical logic without reading code. This aligns expectations between stakeholders and developers.
- Debugging Efficiency: When a bug occurs in a specific interaction, the diagram provides a map to trace the path. Developers can quickly locate where the logic deviates from the plan.
- Onboarding New Members: New team members can study the diagrams to understand the system architecture faster than reading through thousands of lines of code.
- Refactoring Safety: Before changing a component, the diagram helps visualize the impact. If a change affects a link, the developer knows exactly which other objects might break.
- Consistency Checks: It is easier to spot circular dependencies or overly complex coupling when the structure is visualized.
Common Pitfalls to Avoid ⚠️
Even with the best intentions, diagrams can become misleading if not handled correctly. Be mindful of these common issues.
- Overcomplication: Trying to model the entire system in one diagram leads to clutter. Break the system down into manageable scenarios.
- Ignoring Lifecycle: Objects have states. A diagram should reflect the state in which the interaction occurs. A
Cartobject behaves differently when empty versus when it has items. - Static Links Only: Do not confuse structural links with message flow. A link exists permanently (in memory), while a message is a transient event.
- Outdated Models: If the code changes, the diagram must be updated. A diagram that does not match the code is worse than no diagram at all, as it creates false confidence.
- Lack of Context: Do not forget to mention the broader context. What triggers this interaction? What is the expected outcome?
Best Practices for Maintenance 🌱
To keep the diagrams useful, they must be maintained as part of the development workflow. Here are guidelines to ensure longevity and utility.
- Integrate with Code: Keep diagrams alongside the source code in version control. This ensures they are reviewed during code changes.
- Standardize Notation: Agree on a set of symbols and naming conventions. Consistency reduces cognitive load when switching between diagrams.
- Focus on Scenarios: Create diagrams for specific use cases rather than general system overviews. Specificity yields clarity.
- Automate Where Possible: If tools allow, generate diagrams from code annotations. This keeps the model synchronized with the implementation.
- Peer Review: Treat diagrams as code. Have peers review them for accuracy and clarity before finalizing the design.
Integration into the Development Lifecycle 🔄
These diagrams fit naturally into various stages of software engineering. They are not just for the initial design phase.
Design Phase
During architecture reviews, diagrams help validate the proposed structure. They allow the team to critique the design before implementation begins. This is the most cost-effective time to find errors.
Implementation Phase
Developers can use the diagrams as a reference while coding. They act as a checklist to ensure all interactions are implemented correctly. If the code diverges from the diagram, it is a signal to investigate.
Testing Phase
Testers can derive test cases directly from the message flows. Every message represents a potential test scenario. This ensures comprehensive coverage of the interaction logic.
Maintenance Phase
When fixing bugs or adding features, the diagram provides the necessary context. It shows the impact of changes on existing interactions, preventing regression issues.
Advanced Considerations for Complex Systems 🏗️
As systems scale, the diagrams must evolve. Large-scale architectures often require multiple diagrams covering different layers or subsystems.
- Layered Diagrams: Separate concerns by layer. Have one diagram for the presentation layer, another for the business logic, and a third for data access. Connect them at the boundaries.
- Concurrency: Standard diagrams can be ambiguous regarding parallel execution. Use specific notations or notes to indicate where processes run concurrently.
- Asynchronous Messaging: In modern distributed systems, messages are often asynchronous. Represent this clearly with distinct arrow types or notes to avoid confusion about blocking behavior.
- State Changes: If an object changes state significantly during the interaction, consider annotating the object box with the new state to provide context for subsequent messages.
Measuring the Impact on Team Velocity 📈
While diagrams require an upfront investment of time, the return on investment is often measured in reduced rework. Teams that utilize these visual models often report faster debugging sessions and fewer misunderstandings during sprint planning. The clarity reduces the “guesswork” in development.
Furthermore, documentation becomes a living artifact rather than a static requirement. When the diagram reflects the code, it becomes a trusted source of truth. This trust accelerates decision-making. When a question arises about how two modules interact, the team refers to the diagram rather than searching through code repositories.
Final Thoughts on Clarity and Communication 💡
Software development is fundamentally a human endeavor. Code is read by humans, designed by humans, and maintained by humans. Tools that enhance human understanding are invaluable. UML Collaboration Diagrams serve as a bridge between abstract requirements and concrete implementation.
By focusing on the relationships and interactions rather than just the logic flow, teams gain a deeper insight into the system’s structure. This understanding leads to more robust software, easier maintenance, and smoother collaboration. The goal is not to create perfect drawings, but to facilitate clear communication. When the team sees the same picture, they build the same product.
Adopting this practice requires discipline, but the payoff in system stability and team alignment is substantial. Start with small scenarios, refine the notation, and gradually expand the coverage. Over time, the diagrams will become an integral part of the team’s toolkit, simplifying the complex logic that drives modern applications.