Software development and system design often begin with a dense wall of text. Stakeholders, analysts, and clients describe how a system should behave in paragraphs, bullet points, and narrative statements. While essential, text alone is prone to misinterpretation. Ambiguity hides in syntax, and complex logic gets lost in description. This is where visual modeling becomes critical. Specifically, transforming textual requirements into Activity Diagrams bridges the gap between abstract need and concrete execution.
An activity diagram is not merely a flowchart; it is a dynamic representation of workflow. It captures the logic of a system, the sequence of actions, and the conditions under which they occur. When executed correctly, converting text to visuals clarifies concurrency, decision points, and error handling. This guide details the authoritative process of mapping requirements to diagrams, ensuring accuracy without relying on specific proprietary tools.
Understanding the Input: Analyzing Textual Requirements 🧱
The quality of an activity diagram depends entirely on the quality of the input data. Before drawing a single shape or connecting a single arrow, one must dissect the requirements document. Textual requirements come in various forms, each requiring a different approach to visualization.
Identifying Actors and Roles
Every process involves participants. In the context of activity diagrams, these are often referred to as Swimlanes. When reading a requirement, ask: who is performing this action?
- Human Actors: Users, administrators, or support staff.
- System Actors: Automated services, databases, or external APIs.
- External Entities: Third-party services or hardware interfaces.
By categorizing these actors early, you structure the diagram. A requirement stating "The user must verify their email" implies a swimlane for the User and potentially another for the Email System. This separation prevents the diagram from becoming a tangled mess of interactions.
Distinguishing Functional vs. Non-Functional Requirements
Not all text belongs in the flow. You must filter the input.
- Functional Requirements: These describe specific behaviors or actions. They belong in the diagram. Example: "The system shall calculate tax based on the region."
- Non-Functional Requirements: These describe constraints like performance, security, or reliability. While they do not typically appear as nodes, they inform the design. Example: "The calculation must occur in under 200ms." This informs the complexity allowed in the diagram, perhaps suggesting a need for caching or parallel processing.
Spotting Logic Triggers
Look for keywords that indicate decision points or loops. Words like "if," "when," "until," "else," and "repeat" are signals. These require specific notation in the visual model.
- If/Else: Maps to a Decision Node (diamond shape).
- While/For: Maps to a Fork/Join or a loop back arrow.
- Then: Maps to a Control Flow arrow.
Failing to identify these keywords results in a linear diagram that cannot represent the actual system logic. Precision here prevents rework later.
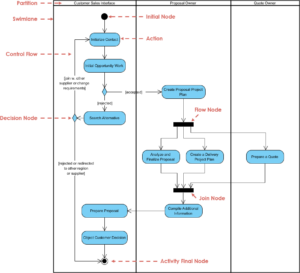
Understanding the Output: Anatomy of an Activity Diagram 🏗️
Before converting, one must understand the notation. An activity diagram consists of specific elements that represent different states of a process. Using standard notation ensures that anyone familiar with the modeling language can interpret the diagram.
| Element | Visual Representation | Meaning |
|---|---|---|
| Initial Node | Filled Circle | The starting point of the process. |
| Final Node | Double Encircled Circle | The successful completion or termination of the process. |
| Activity/Action | Rounded Rectangle | A step or operation performed within the system. |
| Decision Node | Diamond | A branching point based on a condition. |
| Fork/Join Node | Thick Bar | Splitting or merging concurrent flows. |
| Control Flow | Arrow | The direction of flow from one node to another. |
Understanding these symbols is the first step in translation. Each symbol answers a specific question about the requirements text.
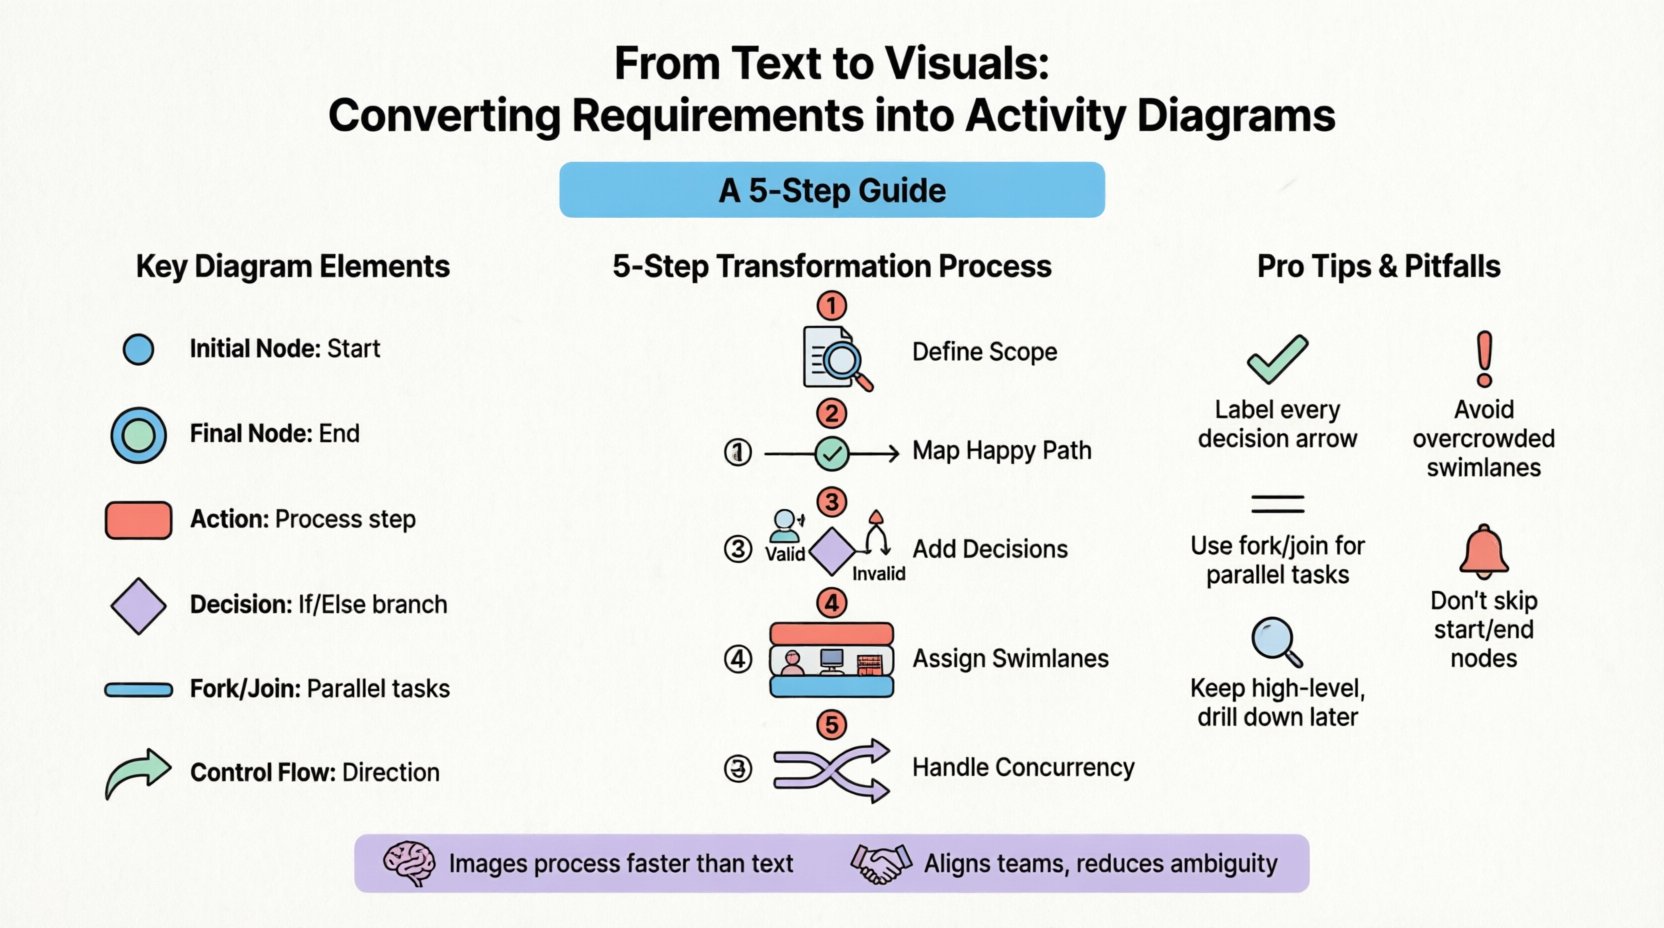
The Transformation Process: Step by Step 🛠️
Converting requirements is a systematic process. It is not about drawing quickly; it is about thinking clearly. Follow this structured approach to ensure fidelity between the text and the visual model.
Step 1: Define the Scope and Entry Point
Begin by placing the Initial Node. Ask: What triggers this activity? Is it a button click? A scheduled job? An external event? This defines the entry point. For example, if the requirement is "Process a user login," the trigger is the submission of credentials.
Step 2: Map the Primary Flow
Trace the happy path first. This is the sequence of actions that occurs when everything works as intended. Ignore errors for a moment. Write down the sequence of actions in order.
- Validate Input.
- Check Database.
- Retrieve Data.
- Display Output.
Draw these as rounded rectangles connected by arrows. Do not worry about swimlanes yet; just get the sequence right. This creates the backbone of the diagram.
Step 3: Integrate Decision Logic
Now, revisit the requirements to find the "if" conditions. Where does the path diverge?
- If the input is invalid, where does the flow go?
- If the data is found, what happens next?
- If the data is missing, is an error generated?
Insert Decision Nodes into the primary flow. Connect the arrows to the diamond. Label the outgoing arrows with the conditions (e.g., "Valid" vs. "Invalid"). This step is crucial for preventing the diagram from looking like a simple checklist.
Step 4: Assign Swimlanes
Once the flow is established, distribute the actions across swimlanes based on the actors identified earlier. Move the "Validate Input" action to the User lane. Move the "Check Database" action to the System lane. This clarifies responsibility. If an action is ambiguous, note it for clarification with the stakeholder.
Step 5: Handle Concurrency
Does the system perform multiple tasks simultaneously? Text requirements often hide parallelism. Look for phrases like "send email" and "send SMS" happening at the same time.
- Use a Fork Node to split the flow into parallel threads.
- Use a Join Node to merge the threads back together once all tasks are complete.
Without this, the diagram implies a sequential wait, which misrepresents the system’s efficiency.
Managing Complexity: Forks, Joins, and Threads ⚡
Real-world systems are rarely linear. They involve parallel processing, retries, and complex state management. Handling these elements requires strict adherence to modeling rules.
Forking and Joining Flows
A Fork creates multiple concurrent threads of control. A Join waits for all incoming threads to arrive before proceeding. This is vital for performance modeling.
Scenario: A user requests a report.
- Text: "Generate the PDF and send the email notification simultaneously."
- Diagram: Split the flow after "Generate Report". One branch goes to "Create PDF", the other to "Send Email". Both branches join at a node before "Notify User Success".
If you join before both threads complete, the system might notify the user before the email is sent. If you do not join, the user might be notified twice or the process might hang waiting for a thread that never started.
Exception Handling
Requirements often state what happens when things fail. "If the payment fails, retry once." This is not just a decision node; it is a loop with a counter.
- Model the Retry Logic explicitly.
- Use a Decision Node to check the status.
- Loop back to the action if the limit is not reached.
- Exit to an error state if the limit is reached.
Neglecting exception flows creates a diagram that only works in a perfect world. This is a common pitfall in system design.
Validation and Refinement ✅
Once the initial diagram is drawn, it must undergo validation. This ensures the visual model matches the textual source and makes logical sense.
Traceability Check
Go through every requirement and mark it off. Did you represent this action? Did you represent this condition? If a requirement is missing from the diagram, either the diagram is incomplete, or the requirement is irrelevant to the workflow. This traceability is essential for quality assurance.
Walkthrough Simulation
Simulate the process mentally or with a stakeholder. Start at the initial node. Move through every path. Does it end? Does it loop infinitely? Is there a path where the user gets stuck?
- Deadlocks: Two threads waiting on each other.
- Unreachable Nodes: Actions that cannot be reached from the start.
- Orphaned Flows: Arrows that do not connect to anything.
Fixing these issues during the design phase saves significant time during development.
Common Pitfalls and Solutions 🚧
Even experienced modelers make mistakes. Understanding common errors helps avoid them.
| Pitfall | Why it Happens | Solution |
|---|---|---|
| Overcrowded Swimlanes | Putting too many actions in one lane. | Split into sub-processes or use object flows. |
| Missing Decision Labels | Arrows have no condition text. | Label every outgoing arrow from a diamond. |
| Confusing Sequence with Parallel | Using arrows for simultaneous tasks. | Use Fork/Join bars for parallelism. |
| Ignoring Initial/Final Nodes | Starting or ending the flow arbitrarily. | Always define clear start and end points. |
| Too Much Detail | Diagramming low-level code logic. | Keep the view high-level; drill down into separate diagrams if needed. |
Keeping the diagram clean is more important than making it comprehensive. A complex diagram is often ignored. A clear diagram is used.
Strategic Best Practices 📋
To maintain high standards throughout the conversion process, adopt these habits.
- Consistency is Key: Use the same terminology in the diagram as in the text. If the requirement says "Submit Order," do not label the action "Finalize Transaction" unless you define the equivalence.
- Layering: Do not try to show everything on one page. Create a high-level overview diagram and detailed sub-diagrams for complex modules. This reduces cognitive load.
- Color Coding: Use color to distinguish between different types of flows (e.g., success, error, warning) if the notation standard allows. However, do not rely on color for meaning alone.
- Review Cycles: Treat the diagram as a living document. As requirements change, the diagram must change. Update it immediately.
- Context Matters: Know the audience. Developers need different details than business analysts. Adjust the level of abstraction accordingly.
The Cognitive Advantage of Visual Modeling
Why go through the effort of converting text to visuals? The answer lies in human cognition. The brain processes images faster than text. Patterns are easier to spot in a graph than in a paragraph. When reviewing a text document, a reader might miss a missing condition. When reviewing a diagram, a missing arrow is immediately obvious.
Visual models facilitate communication. They serve as a single source of truth. When a developer and a stakeholder argue about how a process works, the diagram provides the reference point. It reduces friction and aligns expectations.
Final Thoughts on Model Accuracy
The goal of converting requirements into activity diagrams is not to create art; it is to create clarity. Accuracy is paramount. A diagram that looks good but does not match the requirements is worse than no diagram at all.
Focus on the logic. Ensure every branch is accounted for. Ensure every actor is represented. By following a disciplined approach, you transform vague text into a precise blueprint. This blueprint guides the development team, reduces ambiguity, and ensures the final system meets the intended needs.
Start with the text. Break it down. Map it out. Validate it. The result is a robust model that stands the test of change. This is the essence of effective system analysis and design.