
System architecture requires a clear visual representation to ensure all stakeholders understand how components interact across physical and logical boundaries. The Unified Modeling Language (UML) provides several diagram types, but none are as critical for infrastructure planning as the deployment diagram. This specific diagram type maps the physical hardware resources and the software artifacts that reside upon them. It serves as a blueprint for the runtime environment, bridging the gap between abstract design and concrete implementation.
Understanding how to construct these diagrams ensures that development teams, operations engineers, and architects share a common vision. It clarifies where code executes, how data moves between devices, and what resources are required for stability. This guide explores the mechanics, components, and best practices for creating effective deployment models.
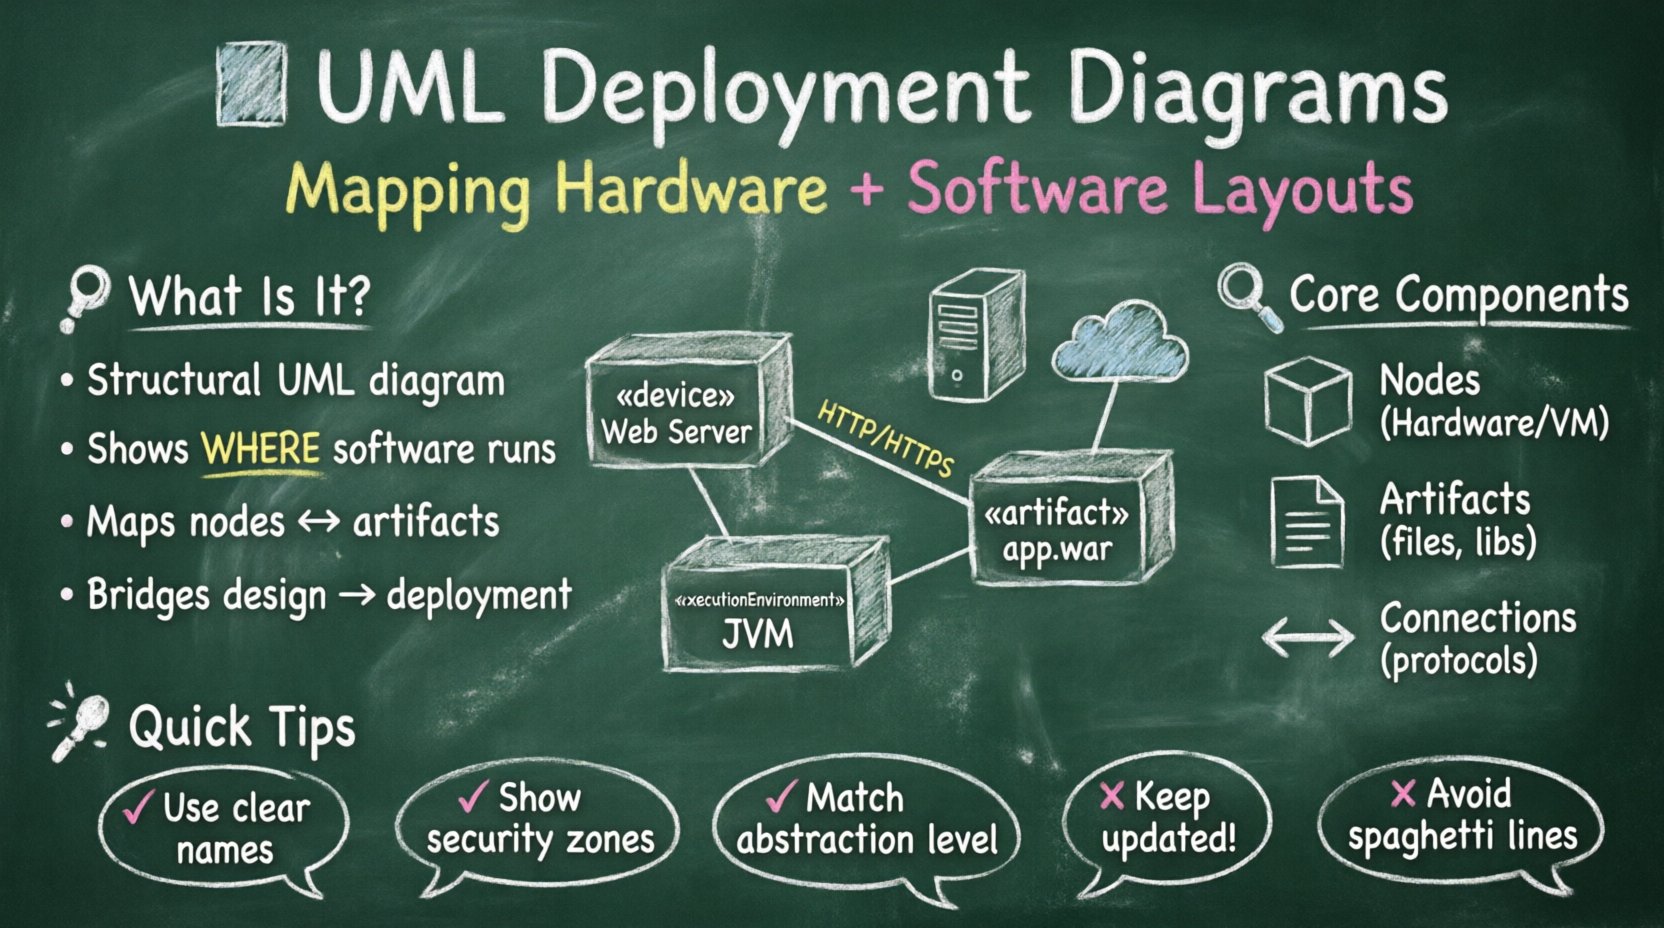
🧩 Understanding the Deployment Diagram
A deployment diagram belongs to the structural diagrams within UML. Unlike class diagrams which describe static structure, or sequence diagrams which describe dynamic behavior, this diagram focuses on the topology of the system. It visualizes the hardware nodes and the software components deployed on them. It answers fundamental questions about the system’s physical architecture:
- Where does the application run?
- What hardware resources are needed?
- How do different nodes communicate?
- What software packages are installed on each device?
This visualization is essential during the design phase of software development. It helps identify bottlenecks, single points of failure, and network security requirements before code is written. By defining the deployment environment early, teams can avoid costly refactoring later when moving from a development environment to production.
🛠️ Core Components of the Diagram
To build a meaningful diagram, you must understand the specific elements used to represent the architecture. These elements fall into three main categories: nodes, artifacts, and connections.
1. Nodes
Nodes represent physical or virtual computing resources. They are the containers for the software artifacts. A node is depicted as a 3D box in standard notation. There are different types of nodes, often distinguished by stereotypes:
- Device Nodes: Represent physical hardware such as servers, routers, workstations, or mobile devices. These are typically labeled with the stereotype «device».
- Execution Environment Nodes: Represent software environments that host other components. Examples include a Java Virtual Machine (JVM), a .NET runtime, or a database engine. These are labeled with «executionEnvironment».
- Abstract Nodes: Represent logical groupings or partitions, such as a cluster of servers or a specific network segment. These might use the stereotype «node».
2. Artifacts
Artifacts represent physical representations of information in the system. They are the software files that are deployed onto the nodes. Examples include executable files, libraries, configuration files, database schemas, and documentation. Artifacts are depicted as documents with a folded corner. They reside inside nodes, showing exactly what software is active on that hardware.
3. Communications Paths
Connections between nodes are just as important as the nodes themselves. These lines represent the communication channels or networks. They indicate how data flows from one device to another. Labels on these lines often specify the protocol being used, such as HTTP, TCP/IP, or MQTT.
🏷️ Stereotypes and Notation
Standard notation provides a baseline, but UML allows for extension through stereotypes. These are text strings enclosed in guillemets (e.g., «stereotype») that modify the meaning of a symbol. In deployment modeling, specific stereotypes help clarify the role of each element without cluttering the diagram.
Using the correct notation prevents ambiguity. A generic box could be a server, a database, or a virtual machine. Explicitly labeling these elements ensures that anyone reviewing the diagram understands the infrastructure requirements immediately.
| Element | Symbol Description | Example Usage | Stereotype |
|---|---|---|---|
| Node | 3D Box | Application Server | «node» |
| Device | 3D Box (often with a chip icon) | Firewall, Router | «device» |
| Artifact | Document (folded corner) | JAR file, SQL Script | «artifact» |
| Interface | Circle (Lollipop) | API Endpoint | «interface» |
| Connection | Line or Arrow | Network Cable, Wi-Fi | Protocol Label |
🔗 Modeling Relationships and Connections
The power of the diagram lies in the relationships between its components. These relationships define how the system functions as a whole. There are several types of links you can draw between nodes and artifacts.
Association
An association link indicates a structural relationship. In deployment diagrams, this often shows that an artifact is deployed on a specific node. It implies a dependency; if the node fails, the artifact cannot run.
Dependency
Dependency links show that one element requires another to function. For example, a database artifact might depend on a specific version of a database server node. If the server version changes, the artifact may need modification.
Communication Path
This is a specific type of association used for network connections. It connects two nodes and represents the physical or logical medium through which they exchange data. You can label these paths with protocol names (e.g., HTTPS, SSH, REST). This is crucial for security audits and network configuration.
Realization
While less common in pure deployment views, realization can link a node to an interface. This shows that a specific hardware component or software environment implements a defined interface, allowing other nodes to interact with it.
📉 Levels of Abstraction in Deployment
A single deployment diagram rarely captures the entire enterprise infrastructure. It is better to create diagrams at different levels of abstraction. This allows you to manage complexity without overwhelming the reader.
- High-Level View: Focuses on major system boundaries. It shows data centers, cloud regions, and major application clusters. This is useful for stakeholders who need to understand the overall topology.
- Mid-Level View: Zooms in on specific application layers. It details web servers, application servers, and database clusters within a single data center.
- Low-Level View: Focuses on individual devices. It shows specific server configurations, operating systems, and installed software packages. This is used by system administrators and DevOps engineers.
Transitioning between these levels requires care. You should use notes or cross-references to indicate that a high-level box represents a detailed diagram elsewhere. This modular approach keeps the documentation maintainable.
📝 Step-by-Step Modeling Process
Creating a deployment diagram is a structured process. It involves identifying the environment, defining the components, and mapping the connections. Follow these steps to ensure accuracy.
- Identify the Scope: Determine which part of the system you are modeling. Is it the entire enterprise, a specific microservice, or a client-side application?
- Define the Nodes: List all the hardware and software environments required. Consider both physical servers and virtual instances.
- Identify Artifacts: List the software components that need to be deployed. Include executables, libraries, and configuration files.
- Map the Deployments: Draw lines from artifacts to nodes to show where they reside.
- Define Connections: Draw lines between nodes to represent network communication. Label them with protocols.
- Review and Validate: Check the diagram against the system requirements. Ensure all necessary hardware is accounted for and all software dependencies are met.
✨ Best Practices for Clarity and Maintenance
Creating a diagram is only half the battle. Keeping it accurate and useful requires discipline. Poorly maintained diagrams become obsolete quickly and lose their value as documentation.
- Use Consistent Naming: Adopt a naming convention for nodes and artifacts. For example, prefix server names with their function (e.g., “WEB-01”, “DB-PRIMARY”).
- Group Related Elements: Use packages or folders to group related nodes. This reduces visual clutter and makes the diagram easier to scan.
- Limit Detail Level: Do not include every single microservice in a high-level diagram. Group them logically.
- Include Version Information: Where critical, note the version of the operating system or runtime environment on the node.
- Use Color Sparingly: While color can help distinguish environments (e.g., production vs. staging), ensure the diagram remains readable in black and white.
- Document Assumptions: If a diagram assumes a specific network topology, note it. This prevents confusion when the infrastructure changes.
⚠️ Common Pitfalls to Avoid
Even experienced architects make mistakes when modeling deployment. Being aware of common errors helps you produce higher quality diagrams.
- Over-Coupling: Drawing too many connections creates a “spaghetti diagram” that is hard to read. Only show necessary communication paths.
- Mixing Concerns: Do not mix logical design (software architecture) with physical design (hardware specs) unless necessary. Keep the focus on deployment.
- Ignoring Security Zones: Failing to show network boundaries, firewalls, or DMZs can lead to security vulnerabilities during implementation.
- Static Diagrams: Deploying software is dynamic. Ensure your diagram allows for updates. If you change the server layout, update the diagram immediately.
- Ignoring Scalability: Do not model a single server for a system that requires load balancing. Show the intended scale in the diagram.
🔗 Integration with Other UML Diagrams
The deployment diagram does not exist in isolation. It interacts closely with other diagrams in the UML suite. Understanding these relationships helps create a cohesive system model.
Component Diagrams
Component diagrams describe the software structure. The deployment diagram maps these components onto physical nodes. An artifact in the deployment diagram often corresponds to a component in the component diagram.
Class Diagrams
Class diagrams define the data structure. While they do not show hardware, they inform the deployment of data stores. For instance, a class diagram showing a large data table might suggest the need for a dedicated database server node.
Sequence Diagrams
Sequence diagrams show interactions over time. They help identify which nodes communicate and what data is exchanged. This information is used to label the communication paths in the deployment diagram.
🔄 Maintenance and Version Control
Infrastructure evolves. Servers are replaced, network topologies change, and software versions update. A deployment diagram must reflect these changes to remain useful. Treat the diagram as living documentation.
When using modeling tools, utilize version control features. Compare versions to see how the architecture has changed over time. This is particularly valuable during post-mortem analysis after system incidents.
Regular reviews are essential. Schedule periodic checks where the diagram is compared against the actual running environment. Discrepancies should be documented and the diagram updated accordingly.
💡 Final Thoughts
The deployment diagram is a vital tool for bridging the gap between software design and system implementation. It provides a clear view of the hardware and software landscape, ensuring that all teams work from the same blueprint. By focusing on accurate components, clear relationships, and proper abstraction levels, you can create diagrams that guide successful system deployment.
Remember that the goal is communication. If the diagram cannot be understood by the operations team or the infrastructure engineers, it has failed its purpose. Keep it simple, keep it accurate, and keep it updated. This approach ensures that your system architecture remains robust and manageable throughout its lifecycle.
Investing time in modeling the deployment environment pays off during the implementation phase. It reduces ambiguity, highlights potential issues early, and aligns the technical team with the operational goals. Whether you are designing a simple web application or a complex distributed system, a well-constructed deployment diagram is a foundation for success.
As technology evolves, the principles of modeling remain constant. Cloud computing, containerization, and microservices change the details, but the need to map software to hardware remains. Mastery of these diagrams ensures you can adapt to new technologies while maintaining a clear understanding of the underlying infrastructure.