
Activity diagrams serve as a cornerstone in visual modeling, offering a dynamic view of system behavior. While basic flows illustrate sequential steps, real-world systems operate in complex, asynchronous environments. Understanding how to represent events, signals, and concurrency is essential for accurate modeling. This guide explores advanced patterns for handling these elements without relying on specific tooling.
Understanding Events and Signals ⚙️
In the context of activity modeling, an event represents a significant occurrence that happens at a specific point in time. Signals are a specific type of event that occur between objects or components. Distinguishing between the two is crucial for clarity.
- Events: Changes in state or conditions. Examples include time passing, a user clicking a button, or a sensor triggering.
- Signals: Asynchronous communication mechanisms. These allow one part of the system to notify another without blocking execution.
Visualizing these elements correctly prevents ambiguity in the logic. A signal does not necessarily imply a synchronous call; it implies a notification. This distinction influences how the receiving activity node behaves.
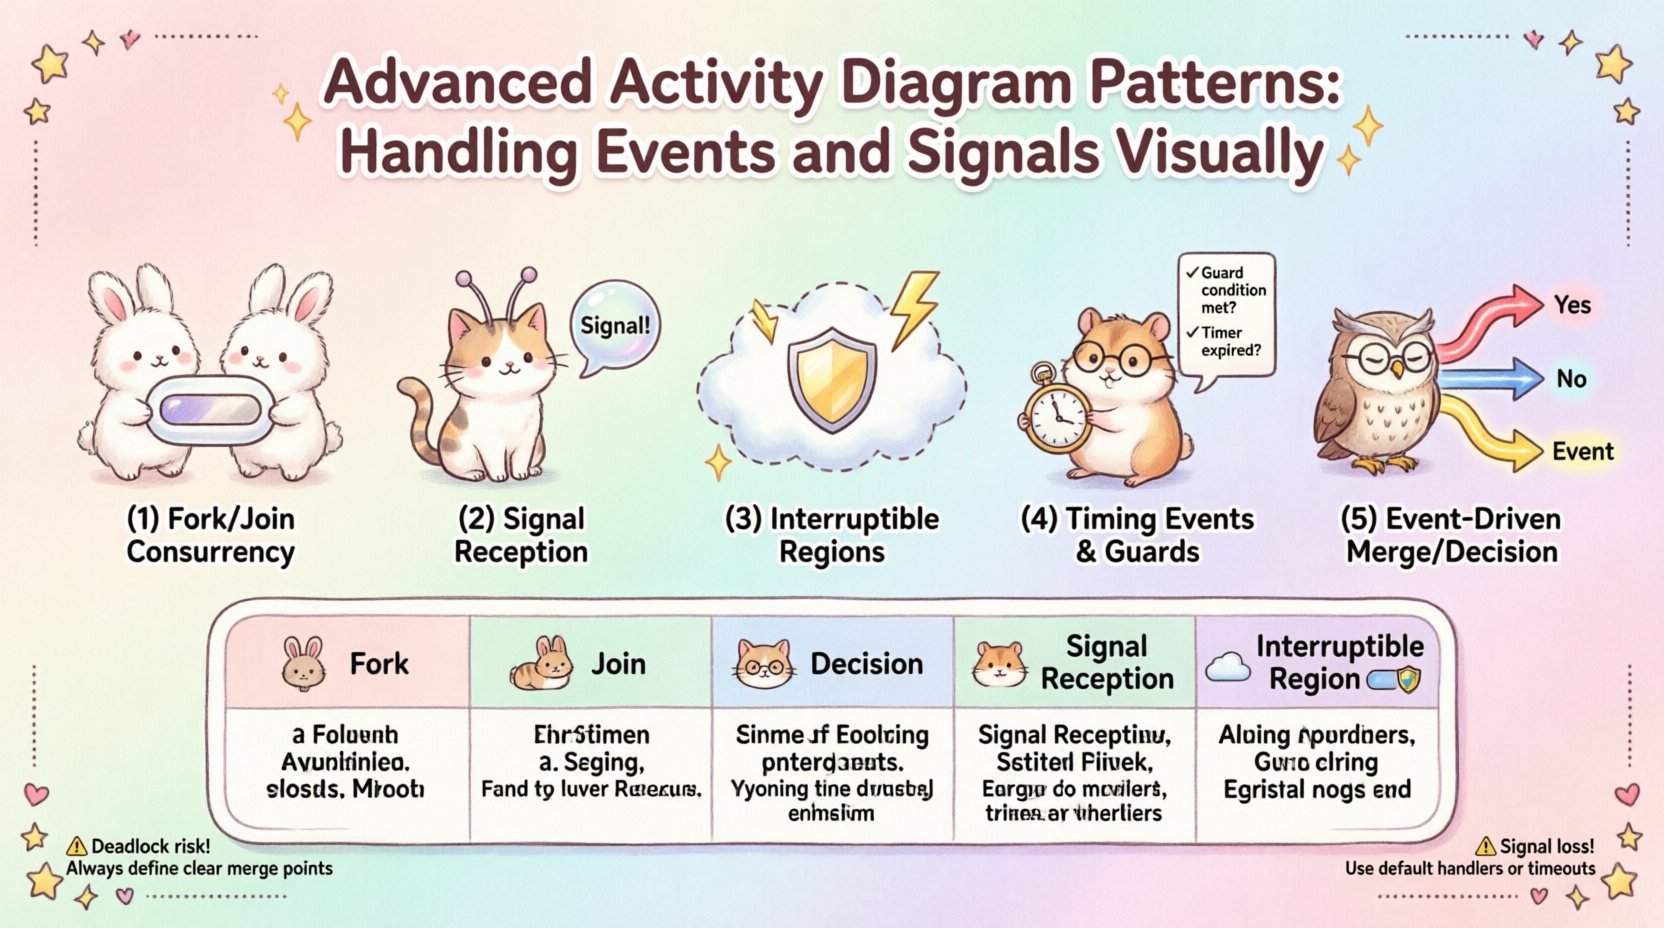
Pattern 1: Fork and Join for Concurrency 🔄
Concurrency is often the source of complexity in activity diagrams. The Fork and Join pattern allows a single flow to split into multiple concurrent threads of execution.
Fork Node Details
- Represented by a thick horizontal or vertical bar.
- Splits the control flow into multiple outgoing edges.
- Execution continues in parallel on all branches.
Join Node Details
- Also represented by a thick bar.
- Combines multiple incoming edges into one outgoing edge.
- Execution resumes only when all incoming branches have completed.
When modeling concurrent processes, ensure that the Join node accurately reflects the synchronization requirement. If one branch takes significantly longer, the entire flow waits. This behavior must be intentional.
Pattern 2: Signal Reception Nodes 📡
Signal reception allows an activity to pause and wait for a specific signal before proceeding. This is vital for event-driven architectures.
- Signal Node: A rounded rectangle with the signal name.
- Reception: The activity waits at this node until the signal is received.
- Post-Processing: Once received, flow continues to the next node.
This pattern differs from a simple decision node. A decision node checks a condition immediately. A signal reception node waits indefinitely until the external trigger arrives. This is critical for modeling asynchronous responses, such as waiting for a payment confirmation or a network packet.
Pattern 3: Exception Handling via Interruptible Regions ⚠️
Long-running processes are susceptible to interruption. Interruptible Regions allow the model to define a block of activity that can be interrupted by an external event.
- Region Boundary: A dashed line enclosing the activities that can be interrupted.
- Interrupt Signal: An event that terminates the flow inside the region.
- Exit Flow: The path taken when an interruption occurs.
Consider a process that monitors a temperature sensor. If the temperature exceeds a threshold, the monitoring process inside the region is interrupted, and a safety shutdown sequence begins. This ensures that safety constraints override normal operational flows.
Pattern 4: Timing Events and Guards ⏱️
Timing events introduce a temporal dimension to the diagram. They trigger actions after a specific duration or at a specific time.
- Time Event: Represented by a clock icon or time label.
- Guard Condition: A logical expression on an edge that determines if the flow is taken.
- Timeout: A specific type of timing event used when an action exceeds an expected duration.
Combining guards with timing events allows for robust logic. For example, an action may proceed only if a condition is met AND a timeout has not occurred. This prevents infinite loops in waiting scenarios.
Pattern 5: Event-Driven Merge and Decision Nodes 🚦
When multiple flows converge, the merge node brings them together. However, if the convergence depends on specific events, a decision node is required first.
- Decision Node: Diamond shape. Checks conditions on incoming flows.
- Merge Node: Diamond shape (often without guards). Simply combines flows.
Using the correct node type prevents logic errors. If flows converge based on mutually exclusive events, a decision node is necessary to route the flow. If flows converge based on independent events that must both happen, a join node is appropriate.
Comparing Event Handling Nodes 📊
| Node Type | Function | Use Case |
|---|---|---|
| Fork | Splits flow | Starting parallel tasks |
| Join | Combines flow | Waiting for all tasks |
| Decision | Routes flow | Conditional branching |
| Signal Reception | Waits for signal | Asynchronous triggers |
| Interruptible Region | Terminates block | Exception handling |
Common Implementation Challenges 🛑
Even with clear patterns, modeling complexity can lead to errors. Below are common pitfalls and how to address them.
- Deadlocks: Occur when two or more flows wait for each other. Ensure Join nodes are reachable from Fork nodes without circular dependencies.
- Unreachable Nodes: Nodes that can never be executed. Review all paths from the initial node.
- Signal Loss: If a signal is sent but not received, the process stalls. Define default behaviors for missing signals.
- Excessive Concurrency: Too many parallel flows make the diagram unreadable. Use sub-activity diagrams to group related concurrent tasks.
Strategies for Clarity and Maintenance 📋
Maintaining activity diagrams requires discipline. As systems evolve, diagrams must remain accurate.
- Standardize Notation: Use consistent symbols for all events and signals across the project.
- Modularize: Break complex diagrams into smaller sub-diagrams. This reduces cognitive load.
- Version Control: Treat diagrams as code. Track changes to understand how logic evolves.
- Review Cycles: Regularly audit diagrams against actual system behavior to ensure alignment.
Integrating Signals in Complex Flows 🔗
In large-scale systems, signals often span multiple activity diagrams. Managing this integration requires a clear interface definition.
- Global Signal Registry: Maintain a list of all signals used in the system to avoid naming conflicts.
- State Validation: Ensure the receiving activity is in a state where it can accept the signal.
- Traceability: Link signals to their source and destination to facilitate debugging.
When signals cross diagram boundaries, use a signal definition node or a clear annotation. This ensures that the receiving team understands the payload and context of the signal.
Refining Logic with Guard Expressions 🧠
Guard expressions add precision to the flow. They determine whether an edge is traversed based on data values.
- Syntax: Use standard logical operators (AND, OR, NOT).
- Readability: Keep expressions simple. Complex logic should be moved to a separate activity or decision tree.
- Testing: Verify that all possible guard conditions are covered by outgoing edges.
A missing guard condition can lead to undefined behavior. If an edge has no guard and multiple edges exist, the flow is non-deterministic. Always define clear conditions.
Handling Non-Deterministic Flows 🎲
Some systems exhibit non-deterministic behavior where the outcome depends on external factors. Activity diagrams can represent this, but it requires care.
- Uncertainty: Use dashed edges or specific annotations to indicate probabilistic outcomes.
- Simulation: Model the system to test various paths and identify potential bottlenecks.
- Documentation: Explicitly note in the legend where non-determinism exists.
While deterministic logic is preferred, acknowledging non-determinism helps in risk assessment. It signals to developers that error handling must be robust.
Conclusion on Signal and Event Mastery 🏁
Effective activity diagramming relies on precise representation of events and signals. By utilizing patterns like Fork, Join, and Interruptible Regions, models become more resilient and accurate. Avoiding common pitfalls ensures that the diagrams remain useful throughout the lifecycle of the system. Continuous refinement and adherence to standards will yield clear, actionable visualizations for complex workflows.