
When designing complex software systems, visual models serve as the blueprint for logic and flow. Among the various Unified Modeling Language (UML) notations, the Communication Diagram stands out for its focus on object relationships. However, misconceptions persist regarding its scope. This guide clarifies the specific boundaries of the communication diagram, separating fact from fiction.
Many developers and architects treat every diagram type as interchangeable. This approach often leads to documentation that is either too dense to read or too vague to be useful. Understanding the specific strengths and weaknesses of the communication diagram ensures that you are using the right tool for the right job. We will explore the structural capabilities, the inherent limitations, and the strategic contexts where this model thrives.
Defining the Communication Diagram 📋
A communication diagram, formerly known as a collaboration diagram, is a behavioral diagram within the UML standard. It depicts the interactions between objects in terms of sequenced messages. Unlike other interaction diagrams, it emphasizes the structural organization of the objects that send and receive messages.
Key structural elements include:
- Objects: Represented as instances of classes, often with their roles clearly defined.
- Links: Connections between objects showing that they can interact.
- Messages: Arrows indicating the flow of information or method calls between objects.
- Sequence Numbers: Numeric tags on messages to indicate the order of execution.
The visual layout is less linear than a sequence diagram. Instead of a strict time-axis, the diagram relies on the spatial arrangement of objects and the numerical sequence of messages to convey flow. This flexibility allows for a more network-like view of interactions, which can be advantageous in systems with many-to-many relationships.
Core Capabilities: What These Diagrams Excel At 💪
Understanding what a diagram can do is as important as knowing what it cannot. The communication diagram shines in specific architectural contexts. It provides a high-level overview of how parts of a system collaborate to achieve a specific goal.
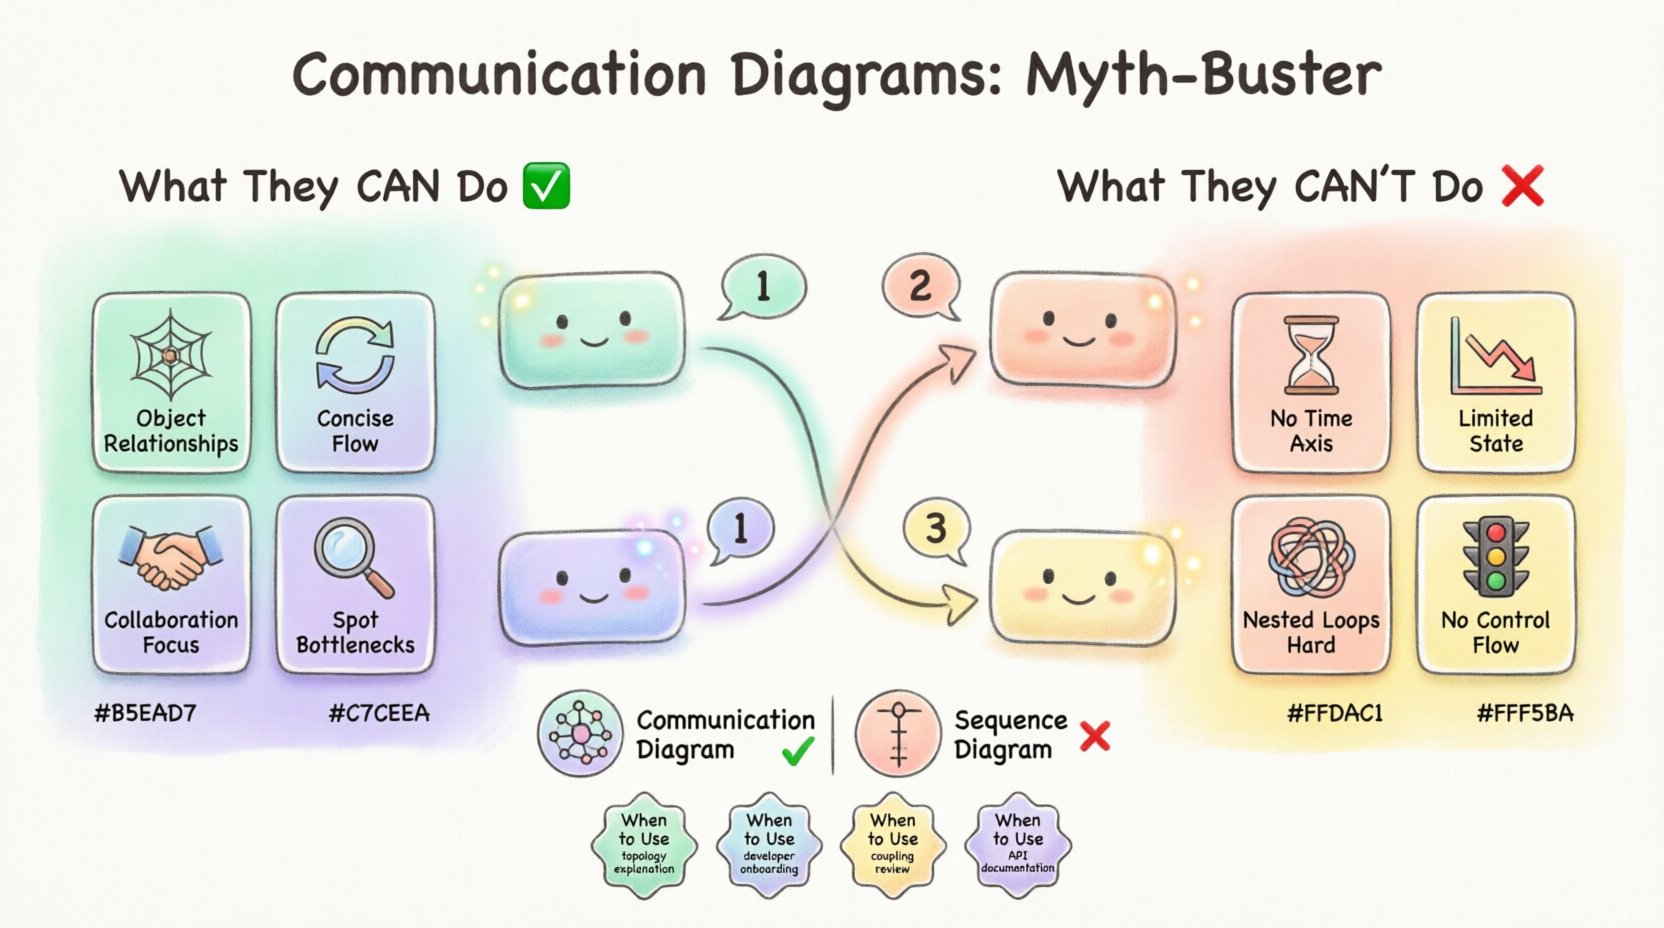
1. Visualizing Object Relationships 🕸️
The primary strength lies in showing the structural links. When you need to understand which objects are directly connected, this diagram offers clarity. It highlights the physical or logical pathways through which data travels.
- It clearly shows which objects hold references to others.
- It helps identify potential coupling issues in the design.
- It provides a map of the system’s topology during a specific operation.
2. Concise Interaction Flow 🔄
For smaller scopes, this diagram is efficient. If you have a scenario involving five or fewer objects, the communication diagram often takes up less space than a sequence diagram. It avoids the vertical scrolling required by sequence diagrams when interactions span many lines.
- It reduces vertical whitespace.
- It allows for a compact view of the entire interaction.
- It is easier to print on standard page sizes for documentation.
3. Emphasizing Collaboration Over Timing 🤝
When the timing of a message is less critical than the fact that it occurs, this model is preferred. It abstracts away the strict temporal dependencies, focusing instead on the partnership required to complete a task.
- It removes the visual noise of explicit time markers.
- It focuses on the logical dependency rather than the chronological one.
- It is better for describing functional requirements rather than implementation details.
4. Identifying Structural Bottlenecks 🔍
Because the links are explicit, it is easier to spot nodes that are overloaded with connections. If one object is sending and receiving ten messages in a diagram, it signals a potential design flaw where that object is doing too much.
- High connection counts are immediately visible.
- Centralized objects stand out against distributed ones.
- It aids in refactoring decisions regarding object responsibilities.
Critical Limitations: What They Cannot Represent 🚫
Despite their utility, communication diagrams have strict boundaries. Using them for tasks outside their design intent leads to confusion and maintenance nightmares. It is vital to recognize where this notation falls short.
1. No Explicit Time Axis ⏳
This is the most significant limitation. Unlike a sequence diagram, there is no vertical timeline. While sequence numbers indicate order, they do not convey duration or concurrency.
- You cannot determine how long a process takes.
- You cannot visualize parallel execution paths clearly.
- Latency issues are not depicted visually.
2. Limited State Representation 📉
Communication diagrams focus on message passing, not state changes. They do not show the internal state of an object before or after a message is received.
- Object attributes are not updated visibly.
- State transitions are implied, not shown.
- Complex state logic must be described elsewhere.
3. Difficulty with Nested Loops 🔄
When interactions involve complex iteration or conditional branching, the diagram becomes cluttered. Sequence numbers can get tangled, making it hard to follow the logic flow.
- Recursive calls can be confusing to trace.
- Nested conditional logic is hard to map.
- Loop boundaries are not visually distinct.
4. Lack of Context for Control Flow 🚦
The diagram does not explicitly show control structures like if-else blocks or switch statements. It shows the messages that happen, but not the logic that decides which messages happen.
- Conditional message paths are hard to denote.
- Exception handling is not visualized.
- Decision points are abstract.
Communication vs Sequence: A Side-by-Side Look 🆚
To fully grasp the limitations, one must compare the communication diagram with its closest relative, the sequence diagram. Both are interaction diagrams, but they serve different cognitive purposes.
| Feature | Communication Diagram | Sequence Diagram |
|---|---|---|
| Primary Focus | Object relationships and links | Temporal ordering of messages |
| Layout | Network-like, spatial | Vertical, timeline-based |
| Complexity | Good for small groups of objects | Good for complex, deep interactions |
| Concurrency | Hard to represent | Easy to represent (vertical bars) |
| Readability | Requires mental sorting of numbers | Requires top-down reading |
| Best Use Case | High-level collaboration overview | Detailed behavioral logic |
Common Misinterpretations in System Design 🤔
Even experienced architects make mistakes when applying this notation. Recognizing these pitfalls helps maintain the integrity of your documentation.
1. Overloading the Diagram
A common error is trying to fit the entire system logic into one communication diagram. This results in a “spaghetti” web of lines that is impossible to decipher.
- Break down complex systems into sub-scenarios.
- Use multiple diagrams for different features.
- Avoid showing every single method call in one view.
2. Confusing Links with Data Flow
Links represent structural relationships, not data flow. Assuming a link means data is constantly moving can lead to incorrect assumptions about memory usage and performance.
- A link implies a reference exists, not active transmission.
- Data flow is only shown during the message arrow.
- Do not treat static links as active pipelines.
3. Ignoring the Lifecycle
Communication diagrams do not show object creation or destruction. Assuming objects exist throughout the interaction without verification can lead to null pointer errors in implementation.
- Creation messages should be explicit if critical.
- Destruction is rarely shown in this notation.
- Assume standard lifecycle management unless noted.
Integrating Communication Diagrams into Your Workflow 🔄
To get the most value, you must integrate this diagram into a broader modeling strategy. It should not stand alone.
1. Pair with Class Diagrams
Since the communication diagram relies on object links, it must align with the class structure. The links shown here must exist in the class diagram.
- Verify that every link has a corresponding association in the class model.
- Ensure object roles match class responsibilities.
- Use the class diagram to define the static structure.
2. Use Sequence Diagrams for Logic
When the communication diagram becomes too complex to follow the order of operations, switch to a sequence diagram. Use the communication diagram for the “who” and the sequence diagram for the “when”.
- Start with communication diagrams for high-level flows.
- Drill down into sequence diagrams for complex methods.
- Use sequence diagrams for concurrency details.
3. Maintain Version Consistency
As code evolves, diagrams must update. Inconsistencies between the diagram and the codebase lead to technical debt.
- Review diagrams during code review sessions.
- Update diagrams when new objects are added.
- Archive outdated diagrams to prevent confusion.
Strategic Planning for Diagram Usage 🗺️
Deciding when to use this diagram requires strategic thinking. It is not a default choice for every interaction.
1. When to Use It
Choose this diagram when the focus is on the architecture of the collaboration. It is ideal for:
- Explaining system topology to stakeholders.
- Onboarding new developers to object relationships.
- Reviewing architectural coupling.
- Creating high-level documentation for APIs.
2. When to Avoid It
Avoid this diagram when the focus is on timing or complex logic. Do not use it for:
- Real-time system synchronization.
- Complex algorithmic flows.
- Security handshake verification.
- State machine transitions.
Final Thoughts on Visual Modeling 🏁
The communication diagram is a powerful tool when applied correctly. It offers a unique perspective on object collaboration that sequence diagrams cannot provide. However, its lack of temporal and state information means it cannot carry the full weight of behavioral documentation alone.
By respecting its limitations and leveraging its strengths, you can create documentation that enhances understanding rather than obscuring it. The goal is clarity. Use the right notation for the specific question you are trying to answer. Whether you are mapping a network of objects or detailing a complex sequence of events, the choice of diagram shapes the clarity of your communication.
Continuous refinement of your modeling skills ensures that your diagrams remain relevant assets. They are not static pictures but living representations of system logic. Treat them with the same care as the code they describe.