
Understanding the dynamic behavior of a system is often more complex than mapping its static structure. While class diagrams show what a system contains, state diagrams explain how it behaves over time. This guide focuses on the UML State Machine Diagram, a critical tool for modeling systems that change state based on events. Whether you are designing embedded firmware, business workflows, or interactive user interfaces, mastering this notation brings order to complexity.
Many teams find this specific diagram type intimidating. The notation can seem dense, and the logic behind transitions often leads to circular reasoning. This article aims to strip away that confusion. We will explore the core components, the syntax, and the practical application of these diagrams without relying on proprietary tools. The focus remains on the fundamental concepts that make system logic clear and maintainable.
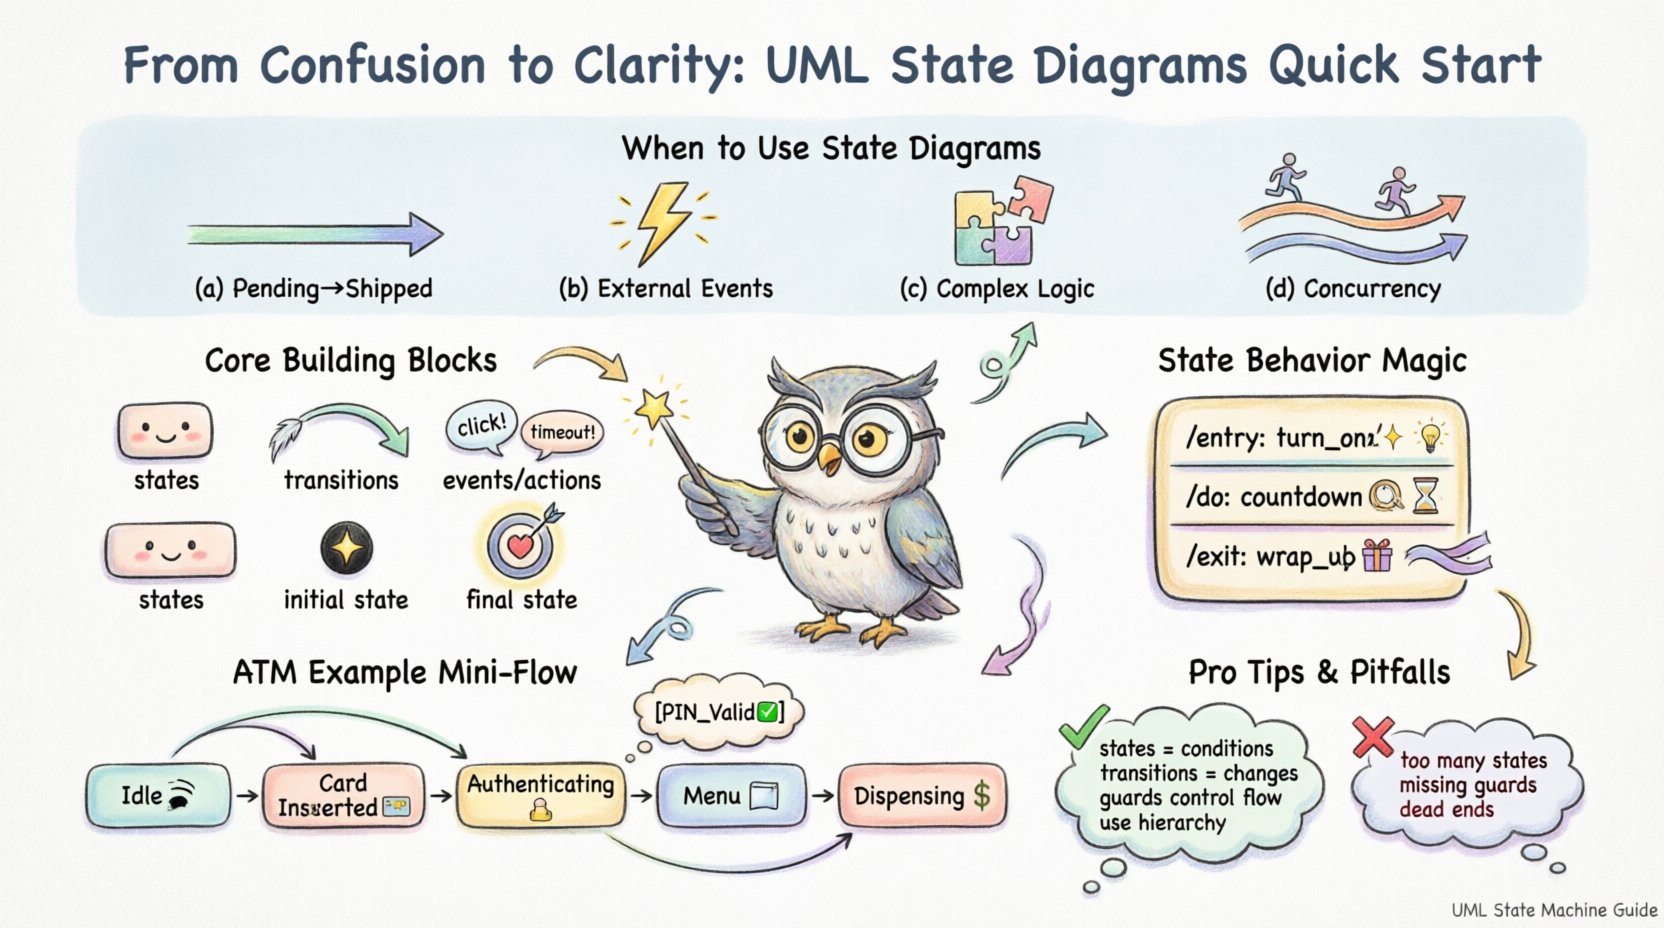
Why Use a State Machine Diagram? ⚙️
Before drawing lines and boxes, it is essential to understand when a state diagram is the right choice. It is not a catch-all solution for every design problem. Use this notation when:
- Object Lifecycle Matters: The object has a distinct lifecycle with specific valid states (e.g., an Order that must go from Pending to Shipped).
- External Events Drive Behavior: The system reacts to external inputs (user clicks, sensor readings, network packets) rather than internal calculations alone.
- Complex Logic Exists: Simple if-else statements become too nested to read. A state diagram visualizes the branching paths clearly.
- Concurrency is Required: The system needs to handle multiple independent processes simultaneously (orthogonal regions).
Conversely, avoid this diagram if you are modeling a simple data flow or a purely computational algorithm without state retention. For those, an Activity Diagram or Sequence Diagram might serve better.
The Core Building Blocks 🧱
A State Machine Diagram is composed of a few fundamental elements. Understanding these is the prerequisite for reading or creating any diagram in this format.
1. States (The Boxes) 🟦
A state represents a condition during the life of an object. In this condition, the object satisfies some condition, performs some activity, or waits for an event. Visually, states are represented by rounded rectangles.
- Simple State: A single state with no sub-states.
- Composite State: A state that contains other states (sub-states). This is used for hierarchy to reduce clutter.
- Initial State: The starting point of the diagram. It is a solid black circle. There should only be one per diagram.
- Final State: The termination point. It is a solid black circle surrounded by a ring. There can be multiple, but usually, the flow ends here.
2. Transitions (The Arrows) ➡️
Transitions define how the system moves from one state to another. They represent the change of state.
- Trigger: The event that causes the transition (e.g., user_login, sensor_timeout).
- Guard Condition: A boolean expression that must be true for the transition to occur. It is written in brackets [condition].
- Action: An executable specification that occurs during the transition (entry, exit, or do).
3. Events and Actions 📢
An event is something that happens at a specific point in time. An action is a computable operation triggered by an event. Distinguishing between the two is vital for accurate modeling.
For example, a button press is an event. The action might be update_display().
Visual Syntax and Notation Rules 📐
Consistency in notation ensures that anyone reading the diagram understands the logic without needing a legend. Below is a reference table for standard UML state machine symbols.
| Element | Visual Representation | Description |
|---|---|---|
| Initial State | ⚫ Solid Circle | Entry point of the state machine |
| Final State | ⚫⭕ Circle with Ring | Termination point of the state machine |
| State | 🟦 Rounded Rectangle | A condition or situation during the life of an object |
| Transition | ➡️ Directed Arrow | Relation between two states |
| Guard | [] Brackets | Condition that must be met for transition |
| Fork/Join | ⚓ Thick Bar | Parallel paths (Fork) or synchronization (Join) |
Notice the use of the thick bar for Fork and Join. These are critical when dealing with parallel processes. A Fork splits one flow into multiple concurrent flows. A Join synchronizes these flows, waiting for all incoming paths to complete before continuing.
Deep Dive: State Behavior 🕒
One of the most powerful features of a state diagram is the ability to define what happens inside a state. This is often overlooked but is where the actual logic lives. A state can define three specific types of behavior:
- Entry Action: Executed immediately upon entering the state.
- Exit Action: Executed immediately upon leaving the state.
- Do Activity: Executed while the state remains active (continuous).
Consider a traffic light system. When the state GreenLight is entered, you might trigger an action like turn_on_led(). If the state RedLight is exited, you might trigger stop_traffic(). While in the state, the system might be performing a do activity, such as countdown_timer().
Notation for Behavior
To keep the diagram clean, these behaviors are listed inside the state box, separated by slashes:
- /entry / action_name()
- /exit / action_name()
- /do / action_name()
For example:
GreenLight
/entry: turn_on()
/do: countdown()
This structure prevents the need for arrows leaving the state to perform internal actions, keeping the diagram focused on transitions.
Advanced Concepts: Hierarchy and Concurrency 🔄
As systems grow, simple linear state diagrams become unreadable. Advanced concepts allow you to manage complexity.
1. Substates (Hierarchy)
Not every state is atomic. A state like ProcessingOrder might have internal states like ValidatingInput, CalculatingTax, and UpdatingInventory. By nesting these inside the parent state, you maintain a high-level view while retaining detail.
- Default Transition: If a parent state is entered, the child state with the default entry is activated.
- Transition Inheritance: Transitions defined on a parent state apply to all child states unless overridden.
2. Orthogonal Regions (Concurrency)
Sometimes, a system must operate in two independent modes at the same time. For example, a Smartphone can be in the PlayingMusic state and the ChargingBattery state simultaneously.
In UML, this is depicted by dividing the composite state into orthogonal regions separated by a dotted line. Transitions in one region do not affect the other. This is a common source of confusion for beginners, but it is essential for modeling real-world devices.
3. History States
What happens if a user leaves a complex composite state and comes back? Do they restart at the beginning, or do they return to where they left off?
- Shallow History: Returns to the default child state, not necessarily the last active one.
- Deep History: Returns to the exact last active substate. This is represented by a circle with an ‘H’ inside.
Using deep history prevents users from losing context in long workflows.
Practical Example: An ATM System 🏧
To ground these concepts, let us walk through a simplified ATM scenario. This example demonstrates how to model a real-world interaction.
Scenario
A user inserts a card. The system authenticates. If valid, they can withdraw cash or check balance. If invalid, they can retry or cancel.
State Breakdown
- Idle: Waiting for a card. (Entry: PowerOn)
- CardInserted: Card detected. (Transition: AuthRequest)
- Authenticating: Checking PIN. (Action: VerifyPIN)
- Menu: Displaying options. (Entry: ShowOptions)
- Dispensing: Giving cash. (Entry: Dispense, Exit: CountCash)
- Error: Invalid PIN. (Entry: ShowError)
Transition Logic
The logic flows from Idle to CardInserted. From there, a transition to Authenticating occurs. If the guard [PIN_Valid] is true, move to Menu. If [PIN_Invalid], move to Error. From Menu, a transition to Dispensing occurs if [WithdrawalSelected].
This level of detail ensures that developers know exactly what triggers a change and what actions occur during the change.
Common Mistakes to Avoid 🚫
Even experienced modelers make errors. Avoid these pitfalls to keep your diagrams accurate.
- Too Many States: If a diagram exceeds one page, it is likely too complex. Break it down into sub-machines or use hierarchy.
- Mixing Logic Types: Do not mix control flow (state machine) with data flow (activity diagram). Keep them separate.
- Missing Guards: Every transition with multiple options needs a guard condition. Otherwise, the path is ambiguous.
- Dead Ends: Ensure every state has a way out, unless it is a final state. Dead states cause system hangs.
- Ignoring Entry/Exit: Forgetting to define what happens when entering a state can lead to initialization bugs.
Integration with Other Diagrams 📊
A state diagram does not exist in isolation. It works best when integrated with other parts of your documentation.
Class Diagrams
The states in your state diagram should correspond to objects defined in your class diagram. The state machine belongs to a specific class or component. Ensure the attributes used in guard conditions exist in the class.
Sequence Diagrams
Use sequence diagrams to detail the internal interactions that occur during an action. If a transition triggers a complex calculation, a sequence diagram can flesh out the message exchanges without cluttering the state diagram.
Activity Diagrams
Use activity diagrams for the internal logic of an action. If an action is simple (e.g., send_email), a state diagram is enough. If the action involves a complex workflow, an activity diagram is better.
Maintaining Your State Models 📝
Diagrams are living documents. As the system evolves, the diagram must evolve with it.
- Version Control: Treat diagram files like code. Commit changes with messages explaining why a transition was added or removed.
- Review Cycles: Include state diagrams in code reviews. Logic errors often show up when reading the diagram before writing the code.
- Documentation Links: Link the diagram to the relevant API documentation. Developers need to know which endpoints correspond to which transitions.
Summary of Key Takeaways ✅
This guide has covered the essential elements of UML State Machine Diagrams. Remember that the goal is clarity, not complexity.
- Use states to represent conditions and transitions to represent changes.
- Define Entry, Exit, and Do activities to control behavior within states.
- Use guards to control the flow of transitions based on data.
- Employ hierarchy and orthogonal regions to manage complexity.
- Avoid dead ends and ensure every state has a defined exit.
By following these principles, you can create documentation that serves as a reliable blueprint for development. The diagram becomes a source of truth, reducing ambiguity between stakeholders and engineers. With practice, the notation becomes intuitive, allowing you to focus on the logic rather than the syntax.
Start with a simple model. Validate it against your requirements. Then expand. The path from confusion to clarity is paved with precise definitions and consistent notation.


")
