
Creating a visual representation of system behavior is a critical skill for any analyst or developer. A UML State Diagram, often referred to as a State Machine Diagram, provides a clear map of how a system reacts to external stimuli over time. This guide walks you through the process of constructing one from the ground up. We will cover the fundamental notation, the logical flow of events, and the structural components required to model complex behaviors accurately.
Understanding state machines is about more than drawing shapes. It is about defining the lifecycle of an object or a process. Whether you are modeling the lifecycle of an order in an e-commerce platform or the behavior of a traffic light controller, the principles remain consistent. By following this structured approach, you can ensure your models are accurate, maintainable, and easy to understand by stakeholders.
Understanding the Core Purpose 🧠
Before picking up a pen or opening a canvas, it is vital to understand what a state diagram represents. Unlike a class diagram, which describes static structure, a state diagram describes dynamic behavior. It answers specific questions:
- What are the distinct conditions an object can be in?
- How does the object move from one condition to another?
- What triggers these changes?
- What actions occur during these transitions?
A state is a condition during which an object waits for an event. A transition is the movement from one state to another. The combination of states and transitions forms the state machine. This visual logic helps identify potential deadlocks, unreachable states, and missing error handling paths before code is written.
Essential Building Blocks 📐
Every state diagram relies on a set of standard elements. Familiarity with these components is necessary for creating a valid model. Below is a breakdown of the primary notation elements you will encounter.
1. States
States represent the conditions of the system. In standard notation, a state is depicted as a rounded rectangle. Inside the rectangle, you typically place the name of the state. If a state has sub-states, it becomes a composite state.
- Simple State: Represents a single condition (e.g., Idle, Processing).
- Composite State: A state that contains other states. It is useful for managing complexity by grouping related behaviors.
- Final State: Represented by a double circle. It indicates the end of the lifecycle for that particular object.
2. Transitions
Transitions connect states. They are drawn as arrows pointing from the source state to the target state. A transition implies that when an event occurs and a condition is met, the system moves to the new state.
3. Events and Triggers
An event is a significant occurrence that causes a transition. It can be a signal received, a timer expiring, or a data change. Events are labeled near the transition arrow.
4. Actions and Guards
Actions describe what happens during a transition or while inside a state. Guards are boolean conditions that must be true for a transition to occur. They are placed in brackets [ ] after the event label.
| Element | Notation | Function |
|---|---|---|
| Initial State | Filled Circle | Start point of the diagram |
| Final State | Double Circle | End point of the diagram |
| State | Rounded Rectangle | Condition where the system waits |
| Transition | Arrow | Move from one state to another |
| Guard Condition | [Condition] | Requirement for transition to fire |
Preparation Phase: Defining the Scope 📝
Before drawing, you must define the boundaries of the system. A common mistake is creating a diagram that is too broad. Focus on a specific object or process. For example, model the Payment Process rather than the entire E-Commerce Website.
Step 1: Identify the Object
Decide what entity you are modeling. Is it a User Session? A File Upload? An Order Status? The name of the diagram should reflect this object.
Step 2: List Possible States
Brainstorm every distinct condition the object can exist in. Write them down without worrying about order yet. Examples might include Created, Verified, Shipped, Delivered, or Cancelled.
Step 3: Determine Events
What causes the object to change state? Is it a user clicking a button? A system timeout? A message from another component? List the events that trigger movement between your states.
Construction Steps: Building the Diagram 🔨
Now that the logic is defined, follow these steps to create the visual model. This process ensures logical flow and consistency.
Step 1: Place the Initial State
Start with the filled circle. This represents the moment the object is created. Draw an arrow from the initial state to the first logical state. This arrow usually represents the immediate transition upon creation.
Step 2: Map Intermediate States
Place your rounded rectangles. Arrange them logically to minimize crossing lines. Group related states together. If a state is complex, consider making it a composite state to hide internal details until needed.
Step 3: Draw the Transitions
Connect the states with arrows. Ensure every arrow has a clear direction. A state machine is a directed graph. You should generally avoid cycles unless they represent a loop in behavior, such as Retrying or Waiting for Input.
Step 4: Label the Events
Add text to the arrows. Standard notation for a transition label is:
EventName [GuardCondition] / ActionName
Example: submitOrder [isValid] / validatePayment
- EventName: What triggered the change?
- GuardCondition: What must be true? (Optional)
- ActionName: What operation is performed? (Optional)
Step 5: Define Entry and Exit Actions
Sometimes an action happens only when entering a state or only when leaving it. Use the keywords entry and exit within the state box.
- Entry Action: Executed immediately upon entering the state. (e.g., entry: initializeTimer)
- Exit Action: Executed immediately upon leaving the state. (e.g., exit: logCompletion)
- Do Action: Executed continuously while the object remains in the state. (e.g., do: monitorSensor)
Advanced Notations for Complex Logic 🚀
Simple diagrams often suffice for basic workflows. However, real-world systems require more sophisticated modeling techniques. These advanced notations help manage complexity without cluttering the diagram.
1. Composite States
When a state contains multiple sub-states, it is a composite state. This is drawn as a larger rounded rectangle containing smaller rectangles. The smaller rectangles represent the internal states of the composite state. This allows you to focus on high-level states while drilling down into details only when necessary.
2. History States
A history state allows a system to remember its previous condition. There are two types:
- Deep History: Remembers the last active sub-state within a composite state.
- Shallow History: Remembers the last active sub-state within the top-level state.
These are represented by a circle with an H inside. They are useful for scenarios where a process is paused and resumed later, needing to return to where it left off.
3. Orthogonal Regions
Sometimes a state machine needs to handle two independent behaviors simultaneously. Orthogonal regions allow you to split a composite state into parallel sections. This is denoted by a partitioned box. Each section operates independently, but they share the same lifecycle context.
Validation and Refinement ✅
Once the diagram is drawn, it must be validated. A diagram with errors is worse than no diagram at all. Use the following checklist to review your work.
- Reachability: Can every state be reached from the initial state? If not, is that intentional?
- Completeness: Are there states with no outgoing transitions? This might indicate a deadlock or an unhandled scenario.
- Uniqueness: Are the event labels on outgoing transitions from the same state unique? If two transitions share the same event, the guard conditions must be distinct to avoid ambiguity.
- Final States: Does the system have a clear end point? Ensure final states are properly connected.
- Consistency: Are state names consistent with the terminology used in the requirements?
Common Pitfalls to Avoid ⚠️
Even experienced modelers make mistakes. Being aware of common errors can save time during the review process.
Spaghetti Diagrams
When a diagram has too many crossing lines, it becomes unreadable. Use composite states to group logic. Break large diagrams into smaller diagrams linked by entry and exit points. Do not force a single diagram to model the entire enterprise system.
Missing Guard Conditions
Leaving out guard conditions can lead to ambiguity. If a transition is possible under all conditions, state that. If it depends on data, explicitly write the condition. Never assume the reader knows the data constraints.
Ignoring Error States
Happy path modeling is common, but systems fail. Ensure you have states for Error, Timeout, or Cancelled. Transitions should exist for these negative scenarios. A state diagram without error handling is often incomplete.
Confusing Activity and State Diagrams
Do not use state diagrams for simple sequential processes. If the focus is on the flow of data or tasks rather than the state of an object, an Activity Diagram might be more appropriate. State diagrams are for objects with a clear lifecycle.
Best Practices for Clarity 📋
A diagram is a communication tool. If the stakeholder cannot read it, it has failed. Follow these guidelines to ensure clarity.
- Naming Conventions: Use nouns for states and verbs for events. Idle is a state. Start is an event.
- Visual Hierarchy: Use size and spacing to indicate importance. Keep the initial and final states prominent.
- Color Usage: If using color, use it consistently. For example, red for error states, green for success states. Do not use color arbitrarily.
- Documentation: Add a legend if you use non-standard symbols. Include a text description of the object being modeled.
- Iterative Refinement: Create a rough draft first. Refine the layout and labels in subsequent versions. Do not try to get it perfect on the first pass.
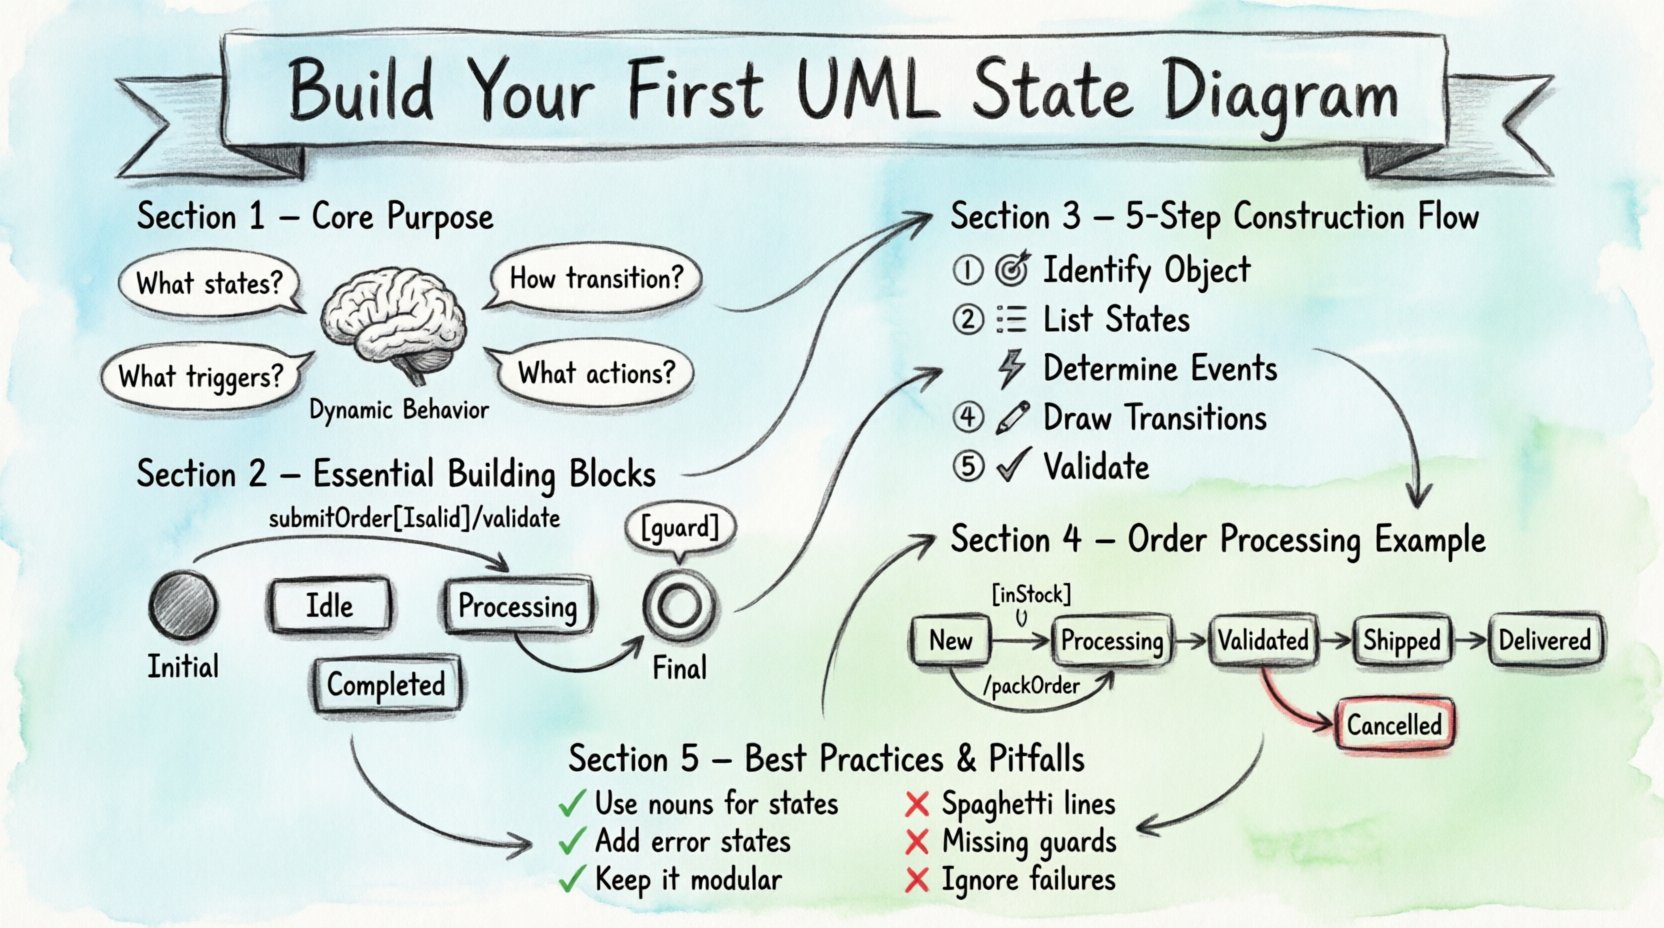
Example Scenario: Order Processing 🛒
To illustrate these concepts, consider an Order Processing system. The object is the Order. The lifecycle begins when an order is placed.
Initial State: New
Transitions:
- New → Processing:
submitOrder - Processing → Validated:
checkInventory [inStock] - Processing → Rejected:
checkInventory [outOfStock] - Validated → Shipped:
authorizePayment / packOrder - Shipped → Delivered:
confirmDelivery - Shipped → Cancelled:
requestReturn
In this example, the Processing state has an exit action to log the attempt. The Validated state has an entry action to generate an invoice. The guard condition [inStock] ensures that the transition only happens if inventory is available.
Final Considerations for Maintenance 📌
A state diagram is a living document. Requirements change, and the system evolves. When a requirement changes, update the diagram. Do not treat the diagram as a static artifact created once and forgotten. Regular reviews ensure the model remains aligned with the actual system behavior.
Integrate the diagram into your documentation repository. Link it to the relevant code modules or API specifications. This traceability helps developers understand the expected behavior of the code they write. It also assists testers in deriving test cases from the transitions.
Remember that simplicity is key. If a diagram looks complicated, try to simplify the logic. Sometimes, splitting the logic into multiple smaller state machines is better than one large one. Modularity in diagrams leads to modularity in code.
By adhering to these standards and practices, you create diagrams that serve as a reliable blueprint for development. The effort invested in modeling pays off during debugging and maintenance phases. Clear state logic reduces ambiguity and prevents costly errors in production environments.
Start with small objects. Master the notation. Gradually increase the complexity. With practice, you will find that building these models becomes an intuitive part of the design process.