
When designing complex systems, understanding how a system behaves over time is just as critical as understanding its static structure. While class diagrams define the data and sequence diagrams define the interaction flow, the UML State Diagram (often called a State Machine Diagram) defines the lifecycle of an object or a system component. This guide cuts through the confusion to provide a clear, authoritative understanding of state modeling without the fluff. We will explore the mechanics, the misconceptions, and the practical applications required for robust system design.
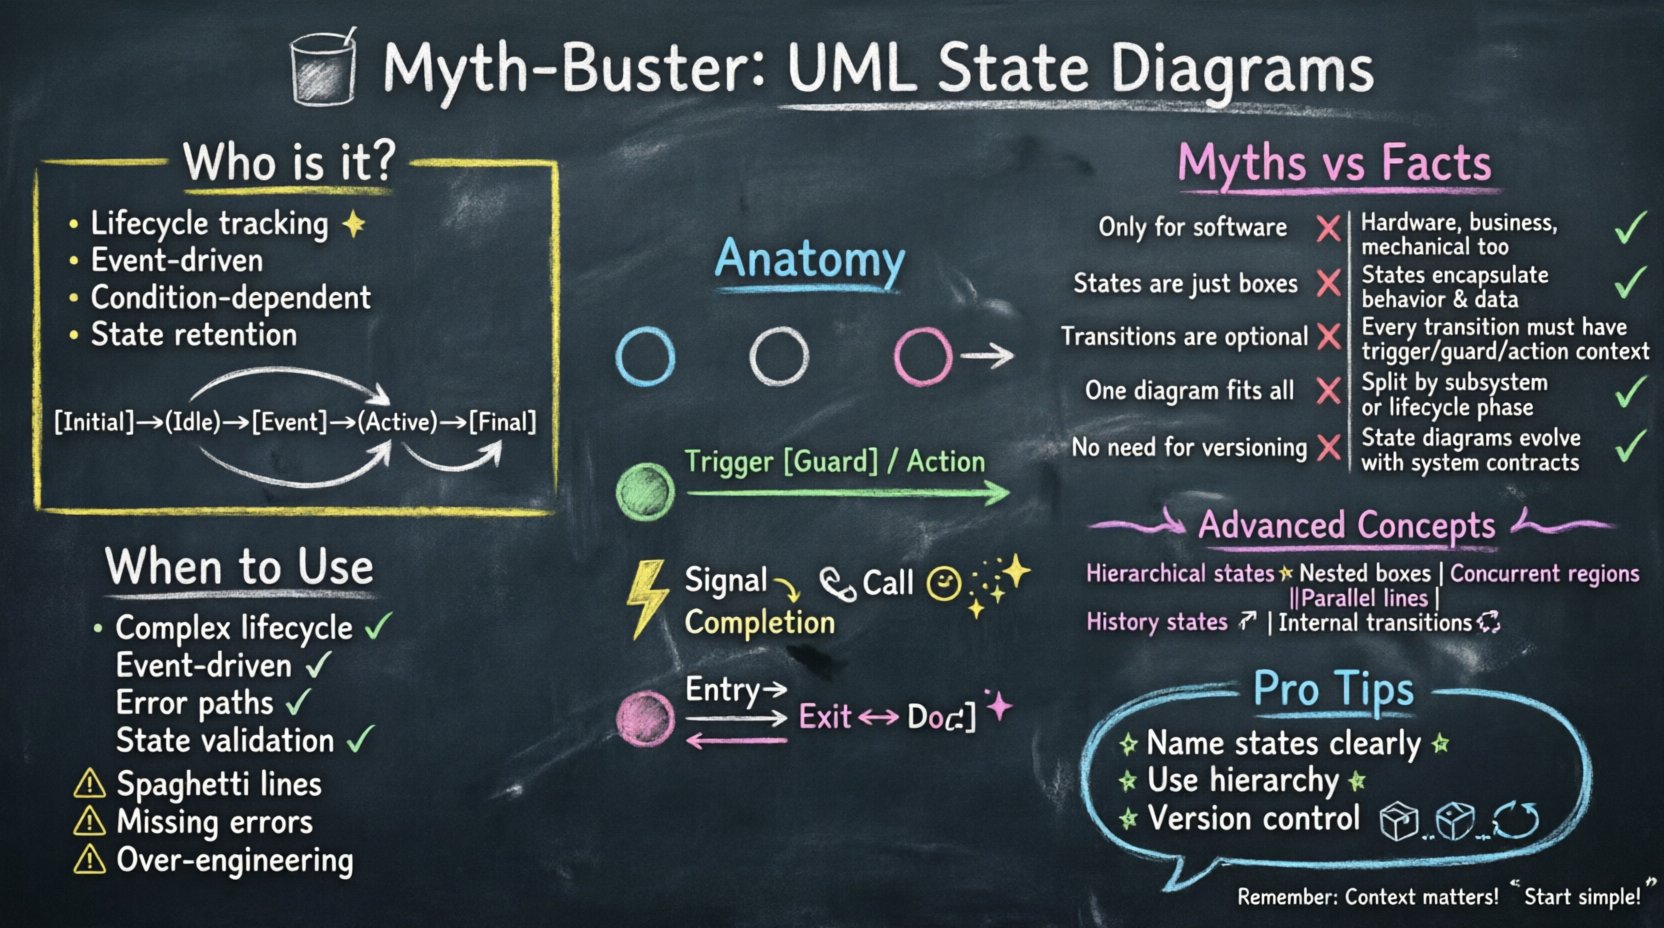
🧩 What is a State Diagram?
A state diagram models the dynamic behavior of a single object or a system. It focuses on the sequence of states an entity passes through in response to events, along with the responses it generates. Unlike a flowchart, which represents the flow of control, a state diagram represents the flow of logic based on the current condition of the object. It provides a visual representation of the possible states an object can be in, the events that cause transitions between these states, and the actions that occur as a result.
This modeling technique is essential for systems where the output depends not only on the current input but also on the history of previous inputs. It captures the internal logic that dictates how a system reacts to external stimuli.
Key Characteristics
- Focuses on Lifecycle: Tracks the journey from creation to destruction.
- Event-Driven: Changes occur only when specific events happen.
- Condition-Dependent: Transitions often rely on guard conditions being met.
- State Retention: The object remembers its current state until a transition occurs.
🚫 Common Myths vs. Facts
There is a significant amount of noise surrounding state modeling. Many practitioners avoid them due to perceived complexity or misunderstand their purpose. Let’s address the most persistent misconceptions with evidence-based facts.
| Myth | Fact |
|---|---|
| State diagrams are only for software. | They apply to hardware, business processes, and mechanical systems too. |
| Every class needs one. | Only use them for objects with complex behavior logic. |
| They replace sequence diagrams. | They complement sequence diagrams by showing internal logic. |
| They are too hard to read. | They become clearer as system complexity increases. |
| They are static documentation. | They can drive code generation and validation. |
Myth 1: It is Just a Flowchart
Many confuse state diagrams with activity or flowcharts. A flowchart shows a path from point A to point B, typically linear or branching based on conditions. A state diagram shows how the system reacts to an event while in a specific situation. If the system is in State A and receives Event X, it goes to State B. If it is in State C and receives Event X, it might stay in State C. This distinction is vital for accurate modeling because state diagrams retain context, whereas flowcharts generally do not.
Myth 2: Complexity is Avoidable
Some believe that state diagrams make simple systems look complicated. While true for trivial logic, avoiding them in complex systems leads to spaghetti code. If a class has conditional logic that depends on its history, a state diagram is the only way to visualize it cleanly. It forces the architect to consider every possible scenario, reducing the likelihood of unhandled edge cases in the final implementation.
Myth 3: They Are Only for Final Design
Some argue that state diagrams should only be drawn after the code is written. This is a reactive approach that misses the point of design. Creating state diagrams during the design phase helps identify logical gaps before implementation begins. It serves as a contract between the designer and the developer, ensuring that the intended behavior is understood by all parties involved.
🛠 Anatomy of a State Machine
To model effectively, you must understand the building blocks. Each component serves a specific function in defining the behavior of the system.
1. States
A state represents a condition during the lifecycle of an object where it waits for an event. It is a period of time during which the object performs some activity or waits for something.
- Simple State: A single condition where the object exists without internal substructure.
- Composite State: A state that contains other states (substates). This allows for hierarchical modeling.
- Final State: The termination of the lifecycle. It is usually represented by a filled circle.
- Initial State: The starting point of the lifecycle. It is usually represented by a filled circle with an arrow pointing out.
2. Transitions
The arrow connecting states. It indicates the movement from one state to another. A transition is triggered by an event.
- Trigger: The event that initiates the change. It can be a signal, a method call, or a time event.
- Guard Condition: A boolean expression that must be true for the transition to occur. If false, the transition is ignored.
- Action: The operation performed during the transition. This can be an update to an attribute or a signal sent to another object.
3. Events
Something that happens at a specific point in time. Events are the catalysts for state changes.
- Signal: Asynchronous communication from one object to another.
- Call: Synchronous request for a service.
- Completion: Time-based or internal task completion, such as the end of an operation.
4. Actions
Activities performed within states or during transitions. Actions are the work done by the system.
- Entry Action: Executed upon entering the state. Used for initialization.
- Exit Action: Executed upon leaving the state. Used for cleanup.
- Do Action: Executed continuously while in the state. Used for monitoring or processing.
🧠 Advanced Modeling Concepts
As systems grow, basic states are not enough. Advanced features allow for more nuanced and accurate modeling of real-world scenarios.
Hierarchical States
You can nest states within states. This reduces clutter and improves readability. If a “Login” state has substates like “Validating” and “Authenticating”, you do not need separate transition lines for every internal event. You only show the transition from the parent state to the outside world. This abstraction allows you to manage complexity by hiding details until they are needed.
Concurrent Regions
Sometimes an object exists in multiple states simultaneously. These are represented by parallel regions separated by a thick line. For example, a “Car” can be “Driving” and “Heating” at the same time. These regions operate independently but share the same lifecycle. This is crucial for modeling systems with independent subsystems that run in parallel.
History States
A history state allows a composite state to remember which substate it was in previously. This is useful for restoring context. When a user exits a composite state and re-enters it, the system can resume from where it left off.
- Deep History: Remembers the deepest substate entered.
- Shallow History: Remembers the immediate substate entered.
Internal Transitions
Internal transitions allow an event to trigger an action without changing the current state. This is useful for handling events that do not require a state change but still need processing, such as logging or validation. It keeps the diagram cleaner by avoiding self-loops that clutter the visual representation.
📊 When to Use State Diagrams
You should not model every class. Use them when:
- The object has a long lifecycle.
- The object has complex conditional logic.
- The behavior is event-driven.
- You need to document error handling paths.
- The system requires strict state validation.
⚠️ Common Pitfalls
Even experts make mistakes. Watch out for these patterns to ensure your models remain useful.
- Spaghetti Diagrams: Too many crossing lines. Use hierarchical states to fix this.
- Missing Error States: Every system needs to know what happens when things go wrong. Explicitly model error handling.
- Ignoring Entry/Exit: Forgetting to clean up resources when leaving a state can lead to memory leaks or inconsistent data.
- Over-Engineering: Modeling a simple
if-elseblock as a state machine. Keep the model proportional to the complexity of the code. - Unreachable States: Ensure every state is reachable from the initial state. Dead code in a model indicates dead code in the system.
🔗 Integration with Other Diagrams
State diagrams do not exist in isolation. They interact with other modeling techniques to provide a complete picture of the system.
Class Diagram
The class diagram defines the attributes and operations available to the state machine. The state machine operates on the data defined in the class diagram. Ensure that the operations triggered by transitions exist in the class structure.
Sequence Diagram
Sequence diagrams show the interaction between objects that triggers the state changes. A sequence diagram might show a user request, which triggers a transition in the state diagram. Use them together to validate that the timing and order of events match the state logic.
Activity Diagram
Activity diagrams can be used for the actions inside the state machine if they are complex. If an action within a state involves a multi-step process, an activity diagram can detail that process without cluttering the state diagram.
📝 Best Practices for Documentation
To ensure clarity for your team and maintainability over time, follow these guidelines.
- Naming: Use clear names for states (e.g., “Processing” instead of “State1”). Names should describe the condition, not the implementation.
- Consistency: Use standard UML notation. Deviations can confuse readers and tools.
- Simplicity: Break large machines into smaller, manageable sub-machines. One diagram per logical component.
- Validation: Check if every state has a path out. Avoid dead ends unless it is a final state.
- Completeness: Ensure all guards are defined. Ambiguity leads to bugs.
- Version Control: Treat state diagrams as code. They should be versioned and reviewed.
🚀 Conclusion
State diagrams are a powerful tool for visualizing behavior. They provide clarity where code might become opaque. By understanding the core components and avoiding common pitfalls, you can create models that improve system reliability. Focus on the lifecycle, respect the event-driven nature, and keep the diagrams aligned with the actual code logic. This approach ensures your documentation remains a valuable asset rather than a burden. Proper modeling reduces technical debt and facilitates better collaboration across the development lifecycle.
Remember that the goal is not to create a perfect diagram, but to create a useful one. Use the model to communicate intent, validate logic, and guide implementation. When done correctly, the effort invested in state modeling pays dividends in system stability and maintainability.


")