
Modern software systems operate in dynamic environments where inputs arrive unpredictably. To manage this complexity, architects rely on patterns that decouple components and allow systems to react to changes rather than pushing data continuously. This approach is known as Event-Driven Architecture (EDA). However, designing such systems requires a clear understanding of how the system behaves over time. This is where UML State Diagrams, often referred to as State Machine Diagrams, become indispensable tools.
This guide explores the intersection of event-driven design and state modeling. We will dissect how states represent conditions, how events trigger transitions, and how to visualize these flows without introducing unnecessary complexity. By the end of this document, you will possess a robust mental model for mapping asynchronous processes into structured diagrams.
🌍 Understanding the Landscape of System Behavior
When designing a distributed system, the flow of data is rarely linear. A user request might trigger a background job, which sends a notification, which updates a database, which then emits a status change. This chain of reactions is the essence of event-driven processing. Without a clear map, these interactions can become a tangled web of dependencies.
A State Machine Diagram provides a visual representation of the different states an object or system can exist in. It defines the permissible transitions between these states based on specific events. Unlike a flowchart, which focuses on the flow of control through a procedure, a state diagram focuses on the lifecycle of an entity.
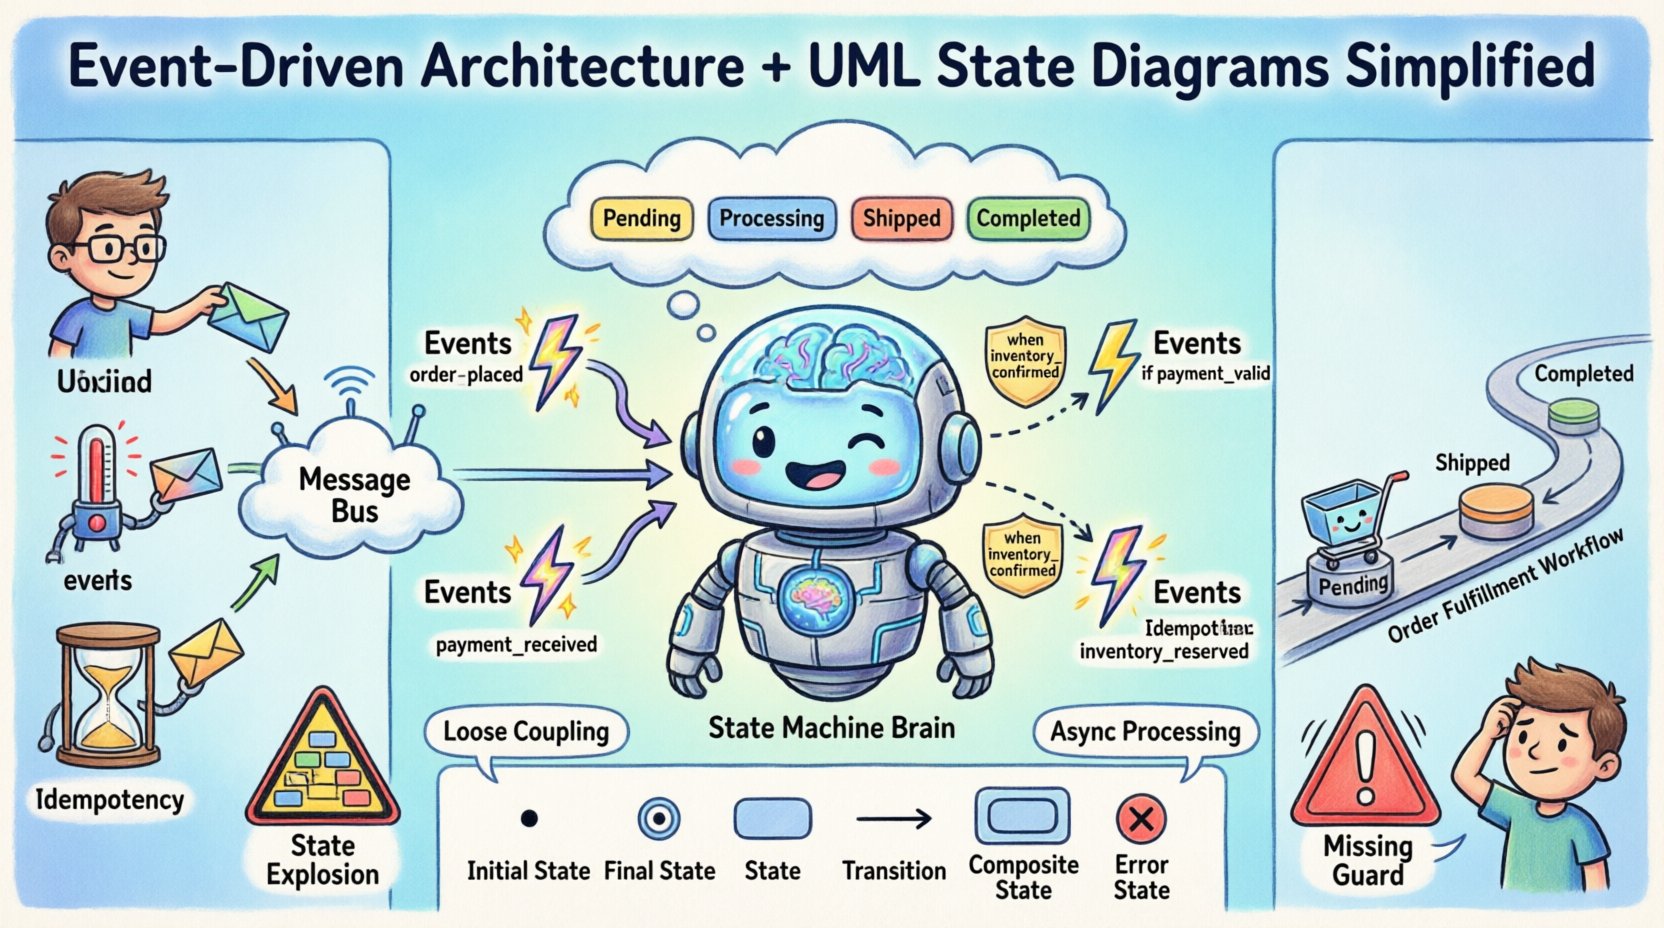
- State: A condition during the lifetime of an object where it satisfies some condition, performs some activity, or waits for some event.
- Event: A significant occurrence that happens at a point in time.
- Transition: The relationship between two states that specifies that an object in the first state will perform certain actions and end up in the second state when a specified event occurs.
In an event-driven context, the state machine acts as the brain of the system, deciding which logic to execute based on the current context and the incoming signal.
⚡ Core Concepts of Event-Driven Systems
To effectively utilize state diagrams, one must first understand the mechanics of the environment they describe. Event-driven systems are built on the principle of loose coupling. Components do not call each other directly; instead, they publish events to a bus or broker and subscribe to events they care about.
1. The Event Source
Events originate from various points within the system. They can be external, such as a user clicking a button or a sensor reading a temperature spike. They can also be internal, such as a timer expiring or a database transaction completing. The key is that the event is a signal, not a command. The receiver of the signal determines how to react.
2. The Event Handler
The handler is the logic responsible for processing the event. In a state-based design, the handler is often specific to the current state. For example, an “Order Cancelled” event might be handled differently if the order is currently “Pending” versus if it is already “Shipped”.
3. Asynchronous Processing
Events allow the system to continue operating without waiting for a response. This improves responsiveness and throughput. However, it introduces challenges regarding consistency and order. State diagrams help visualize these potential race conditions by clearly defining valid sequences of events.
📊 The Role of State Machine Diagrams
Why use a diagram for logic that exists in code? Visualizing the state space reveals gaps in logic that text descriptions often miss. It forces the architect to consider edge cases: What happens if an event arrives while the system is in a “Processing” state?
A well-constructed state diagram answers the following questions:
- What are all the possible conditions the system can be in?
- How does the system move from one condition to another?
- What actions occur upon entering or exiting a state?
- Are there any states from which no exit is possible (deadlocks)?
In complex systems, managing state manually in code can lead to “state explosion.” Diagrams help structure this complexity by introducing hierarchy and orthogonal regions.
🔄 Mapping Events to State Transitions
The core of the diagram is the transition. A transition is triggered by an event and guarded by a condition. If the condition is met, the transition fires, the system leaves the source state, executes any exit actions, and enters the target state, executing entry actions.
1. Trigger Events
These are the catalysts. In an e-commerce scenario, valid triggers for an order might include:
order_placedpayment_receivedpayment_failedinventory_reservedshipment_dispatched
2. Guard Conditions
Not every event leads to a transition. Sometimes, a state machine must ignore an event based on internal data. For example, a “Refund Requested” event should only trigger a transition if the order status is “Completed”. If the order is “Cancelled”, the event is ignored or routed to an error handler.
3. Actions
Actions are activities performed during the state transition. These are typically categorized into:
- Entry Action: Executed when entering the state.
- Exit Action: Executed when leaving the state.
- Do Activity: An ongoing process that occurs while the system remains in the state.
🧩 Key Components Explained
Understanding the visual syntax is crucial for communication among team members. Below is a breakdown of the standard elements used in UML State Machine Diagrams.
| Element | Description | Visual Representation |
|---|---|---|
| Initial State | The starting point of the state machine. There is only one per diagram. | Solid filled circle |
| Final State | The end point. Indicates the lifecycle of the object is complete. | Circle with a dot inside |
| State | A specific condition or situation during the lifecycle. | Rounded rectangle |
| Transition | The arrow connecting states, indicating flow. | Line with an arrowhead |
| Composite State | A state that contains other sub-states (hierarchy). | Larger rounded rectangle containing smaller ones |
Using these components allows you to abstract complexity. For instance, a “Payment” state might be a composite state containing sub-states for “Processing”, “Verified”, and “Failed”.
🛠️ Advanced State Modeling Techniques
As systems grow, simple linear state diagrams become insufficient. Advanced modeling techniques help manage this growth without sacrificing clarity.
1. Hierarchical States
Not every state needs to be at the same level of granularity. Hierarchical states allow you to group related states under a parent state. This reduces the number of transitions required. If a parent state has a default behavior for an event, child states inherit it unless they define their own transition.
- Benefit: Reduces visual clutter and repetition.
- Example: A “Processing” state might contain “Validating”, “Calculating”, and “Storing” as sub-states.
2. Orthogonal Regions
Sometimes, a system has multiple independent aspects that change simultaneously. Orthogonal regions allow you to define parallel state machines within a single composite state. This is useful for systems that need to track both “Status” and “Location” independently.
- Benefit: Models concurrent behavior without spaghetti logic.
- Example: An IoT device tracking “Power State” (On/Off) and “Connectivity State” (Connected/Disconnected) simultaneously.
3. History States
When a composite state is exited and then re-entered, the system might need to return to the specific sub-state it was in previously. History states record the last active sub-state.
- Benefit: Preserves context across interruptions.
- Example: A user logs out while editing a form. When they log back in, the system returns to the exact field they were editing.
⚠️ Common Pitfalls and Solutions
Designing state machines is not without risks. Several common mistakes can lead to brittle systems or confusing documentation.
- State Explosion: Creating too many atomic states leads to a diagram that is impossible to maintain.
Solution: Use composite states to group related behaviors. - Unclear Transitions: If a transition does not specify an event or guard, it creates ambiguity.
Solution: Always label transitions with the triggering event. - Ignoring Error Handling: Diagrams often show the “Happy Path” but ignore exceptions.
Solution: Include a “Error” or “Retry” state to capture failure modes. - Hidden State: Sometimes, the state is not explicitly stored, leading to race conditions.
Solution: Ensure the state is persisted in the database or cache before processing events.
📈 Designing for Scalability and Resilience
Event-driven systems often scale by adding more consumers. The state machine must be designed to support this distribution. If a state is stored locally, it cannot be shared across multiple instances.
1. Distributed State Management
In a microservices architecture, the state of a business entity (like an Order) is often owned by a specific service. The state machine should be encapsulated within that service. External services should only interact via events.
2. Idempotency
Events may be delivered multiple times in an event-driven system. The state machine must handle duplicate events gracefully. If an event moves the state from A to B, receiving it again should not move it to C unless the state changes.
3. Observability
Since the flow is asynchronous, debugging is difficult. The state diagram should align with logging and tracing strategies. Every transition should ideally emit a log entry that captures the timestamp, the source state, the target state, and the event ID.
📊 Comparison of Modeling Approaches
While state diagrams are powerful, they are not the only tool. Choosing the right diagram for the right problem is part of the design process.
| Diagram Type | Best Used For | Limitations |
|---|---|---|
| State Diagram | Modeling lifecycle, complex logic, and reaction to events. | Does not show timing or sequence well. |
| Flowchart | Linear processes and decision paths. | Hard to model concurrent or asynchronous flows. |
| Sequence Diagram | Showing interactions between objects over time. | Does not define the internal state of objects. |
| Activity Diagram | Workflows and business processes. | Less focus on object behavior and more on process flow. |
Using a combination of these diagrams provides a holistic view. The State Diagram defines the behavior of the core entities, while Sequence Diagrams define how those entities interact with external systems.
🛠️ Implementation Considerations
Translating the diagram into code requires discipline. The logic of the state machine should be separated from the business logic to ensure testability.
- State Machines as Classes: Implement the state machine as a distinct class or module. This class should accept events and return the new state.
- Configuration Driven: Define transitions in a configuration file or database rather than hardcoding them. This allows changes to the workflow without code deployment.
- Validation: Ensure that the code enforces the rules defined in the diagram. If the diagram says a state is terminal, the code should prevent further events from entering it.
- Versioning: State machines evolve. Plan for versioning your state definitions so that legacy data can be migrated to new state schemas.
🔄 A Practical Example: Order Fulfillment
Consider an online retail system. The lifecycle of an order is a classic candidate for a state diagram.
- Initial State: Order Created
- State: Pending Payment
- Event:
Payment Success-> Transition to Processing - Event:
Payment Failure-> Transition to Cancelled
- Event:
- State: Processing
- Event:
Inventory Available-> Transition to Shipped - Event:
Inventory Unavailable-> Transition to Backordered
- Event:
- State: Shipped
- Event:
Delivered-> Transition to Completed - Event:
Return Request-> Transition to Return Processing
- Event:
This structure ensures that an order cannot be shipped before payment is confirmed. The diagram enforces business rules visually and logically.
🧩 Managing Complexity in Large Systems
When dealing with enterprise-level applications, state diagrams can become massive. To manage this, adopt a modular approach.
- Decompose: Break the system into bounded contexts. Each context has its own state diagram.
- Document: Maintain a living document of the state diagrams. Outdated diagrams are worse than no diagrams at all.
- Review: Include state transitions in code review checklists. Ensure the implementation matches the design.
By adhering to these practices, teams can maintain clarity even as the system scales. The visual contract provided by the diagram serves as a reference point for developers and stakeholders alike.
🔍 Frequently Asked Questions
Q: Can a state machine be event-driven?
A: Yes, state machines are inherently event-driven. They wait for an event to trigger a transition.
Q: Do I need a state machine for every component?
A: No. Use them for components with complex lifecycles. Simple data models do not require state diagrams.
Q: How do I handle timeouts?
A: Timeouts can be modeled as internal events. If a timer expires within a state, it triggers a transition to a “Timeout” or “Retry” state.
Q: Is this pattern suitable for real-time systems?
A: Absolutely. Real-time systems rely heavily on state changes to react to sensor data and user inputs quickly.
🎯 Final Thoughts on System Design
Designing robust systems requires more than just writing efficient code. It requires understanding the flow of time and the conditions under which that flow occurs. Event-Driven Architecture provides the mechanism for handling asynchronous inputs, while UML State Diagrams provide the structure for managing the resulting behavior.
By combining these two concepts, architects can build systems that are not only responsive but also predictable. The diagrams serve as a contract between the design and the implementation, reducing ambiguity and technical debt. As you move forward with your projects, remember to visualize the lifecycle of your data. A clear map prevents getting lost in the complexity of modern software development.
Focus on clarity, maintainability, and precision. These principles will guide you through the challenges of building resilient, scalable architectures.