
System behavior is rarely linear. Software and hardware systems react to inputs, maintain internal conditions, and transition between different modes of operation. Capturing this dynamic behavior is crucial for robust engineering. The Unified Modeling Language (UML) State Machine Diagram, often simply called the UML State Diagram, serves as the primary tool for this task. It bridges the gap between abstract requirements and concrete implementation logic.
This guide outlines a structured workflow for transforming textual requirements into a precise state model. By following a disciplined approach, engineers can ensure that system behavior is fully defined, testable, and aligned with stakeholder needs. We will explore the anatomy of state diagrams, the step-by-step modeling process, and advanced techniques for handling complexity.
Understanding the Core Components ⚙️
Before initiating the workflow, it is essential to understand the vocabulary of the State Machine Diagram. Unlike a class diagram that describes structure, a state diagram describes behavior over time. Every element in the diagram corresponds to a specific aspect of system operation.
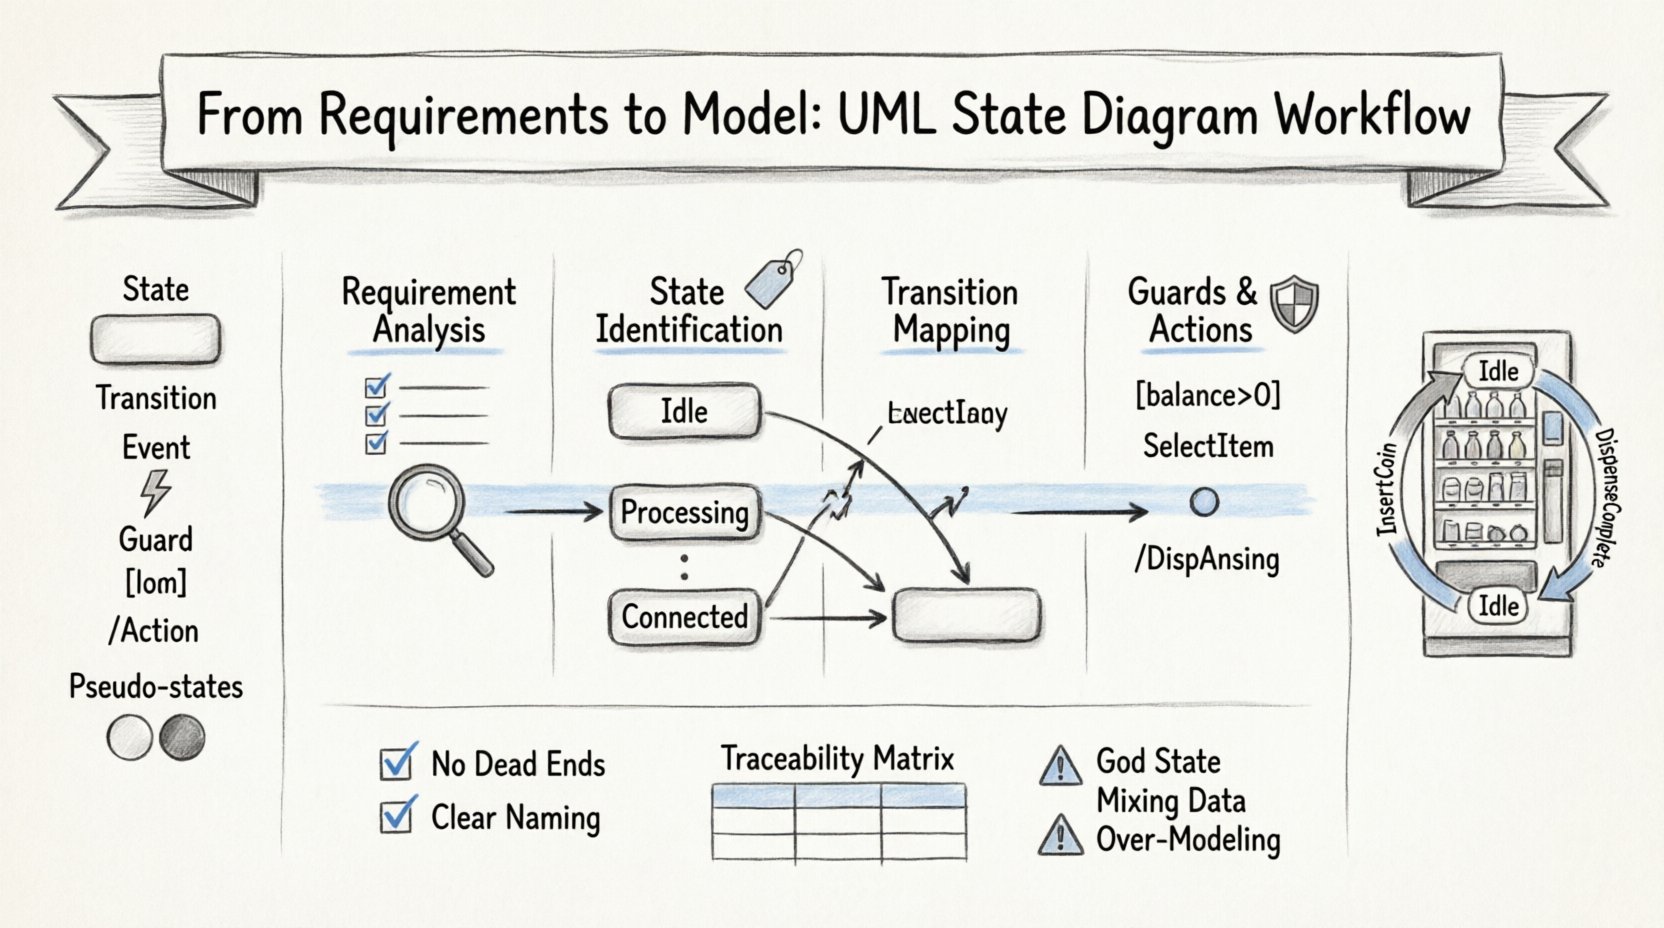
- State: A condition or situation during the life of an object during which it satisfies some condition, performs some activity, or waits for some event. Visually, this is a rounded rectangle.
- Transition: The relationship between two states that indicates a state change. It is triggered by an event. Represented by a solid arrow.
- Event: Something that happens at a specific point in time and causes a transition. Examples include button clicks, timer expirations, or data arrivals.
- Guard Condition: A Boolean expression that must be true for a transition to occur. It acts as a gatekeeper for the flow.
- Action: An executable computation that is performed upon entry, during, or upon exit of a state or transition.
- Pseudo-States: Specialized states used to control flow, such as Initial (filled circle), Final (double circle), and History states.
These components work together to form a finite state machine. The goal of the modeling process is to define every possible state and the logic governing movement between them.
The Workflow: Transforming Requirements into Models 🔄
Building a state diagram from scratch can be overwhelming without a roadmap. The following workflow breaks the process into manageable phases, ensuring that no requirement is missed and no state is ambiguous.
Phase 1: Requirement Analysis and Scope Definition 🔍
The foundation of a good model lies in the requirements. These are typically found in functional specifications, user stories, or system design documents. The objective here is to identify all behavioral requirements related to the system’s internal logic.
- Identify Behavioral Requirements: Scan documents for keywords like “must respond to,” “cannot proceed until,” “upon receiving,” or “if condition X then state Y.”
- Define Boundaries: Determine what is inside the system and what is outside. The state diagram models the internal logic. External triggers are events; internal changes are state transitions.
- List Key Actors: Who or what triggers the events? Users, sensors, other systems, or timers?
Phase 2: State Identification and Naming 🏷️
Once the requirements are understood, the next step is to extract the states. A state represents a stable condition of the system.
- Extract Nouns: Look for nouns in the requirements that describe conditions (e.g., “Idle,” “Processing,” “Locked,” “Connected”).
- Apply the “Is In” Test: Ask, “Can the system be in this condition?” If yes, it is a candidate state.
- Avoid Action States: States are not actions. “Sending Data” is an action. “Data Sent” is a state. Do not confuse the two.
- Ensure Mutual Exclusivity: At any given moment, the system should be in exactly one state (unless using composite states with orthogonal regions).
Phase 3: Transition Mapping and Event Triggering 🚦
With states defined, we connect them. Transitions represent the movement from one condition to another.
- Identify Triggers: For every requirement that describes a change, identify the event. Is it a signal? A message? A timeout?
- Draw the Arrows: Connect the source state to the destination state with a transition arrow.
- Label the Transition: Use the standard notation:
Event [Guard] / Action. - Check Completeness: Are there paths that lead nowhere? Are there paths that loop back unexpectedly?
Phase 4: Guard Conditions and Actions 🛡️
Not every transition happens automatically. Conditions must often be met.
- Define Guards: If a requirement says “only move to State B if the balance is positive,” add
[balance > 0]to the transition. - Specify Actions: What happens during the move? Does a log entry get created? Does a signal get sent? Specify these in the transition action section.
- Entry/Exit Actions: Some activities happen automatically upon entering a state. For example, “Upon entering ‘Login’ state, clear previous session data.”
Advanced Modeling Concepts 🧠
Simple linear flows are rare in complex systems. To handle real-world scenarios, advanced features of the State Machine Diagram are required.
Composite States and Orthogonal Regions 📦
When a state contains its own sub-states, it is called a composite state. This allows for hierarchical modeling.
- Nesting: Inside a “Connected” state, you might have “Idle,” “Transferring,” and “Syncing” states. This reduces clutter on the main diagram.
- Orthogonal Regions: Sometimes a system has independent aspects of behavior that run simultaneously. These are represented as split regions within a single state box. For example, a camera system might have an “Exposure” state and a “Shutter” state running at the same time.
History States (Shallow and Deep) ⏳
When a system leaves a composite state and returns, where should it go?
- Shallow History: Returns to the most recently active top-level sub-state of the composite state.
- Deep History: Returns to the specific state where the system was left, preserving the entire history of nested states.
Using history states prevents the system from resetting to a default start position every time it re-enters a complex mode, which is often undesirable.
Ensuring Quality and Traceability ✅
Creating the diagram is only half the battle. The model must be verified against the original requirements to ensure accuracy and completeness.
The Traceability Matrix
A table linking requirements to diagram elements helps verify coverage. This matrix ensures that every requirement has a corresponding visual representation.
| Requirement ID | Requirement Description | State Element | Transition Element | Status |
|---|---|---|---|---|
| REQ-001 | System must enter ‘Idle’ upon power-up | Initial State → Idle | Power-On Event | Verified |
| REQ-002 | System cannot print if out of paper | Out of Paper State | Transition Guard [PaperPresent] | Verified |
| REQ-003 | User can cancel operation at any time | Cancel Event | Transition from All States to Idle | Verified |
| REQ-004 | System must log errors during ‘Processing’ | Processing State | Entry Action [Log Error] | Verified |
Verification Checklist
Before finalizing the model, run through this checklist:
- No Dead Ends: Every state must have a way out, unless it is a Final State.
- No Deadlocks: Ensure there are no states where the system gets stuck waiting for an event that never arrives.
- Clear Naming: Are state names descriptive enough for a developer to understand without reading the text?
- Consistency: Is the notation consistent throughout the diagram? (e.g., using the same style for all events).
- Event Uniqueness: Within a single state, do not have two transitions with the same event name unless they have different guards.
Common Pitfalls and Anti-Patterns 🚫
Even experienced modelers can fall into traps. Recognizing these patterns early saves significant refactoring time later.
1. The “God State” Problem
Avoid creating a single state that handles too many different behaviors. If a state has twenty incoming transitions and thirty outgoing transitions, it is likely a design flaw. Decompose this state into smaller, more specific states.
2. Mixing Data and Behavior
State diagrams should focus on behavior, not data storage. Do not model every variable as a state. If a variable changes but the system’s behavior remains the same, it is not a state. Use state variables or data attributes instead.
3. Over-Modeling the Initial Flow
It is tempting to draw every possible edge case immediately. Focus on the happy path and critical error handling first. Detailing every minor exception can clutter the diagram and make it unreadable. Add complexity incrementally.
4. Ignoring Exception Handling
A common mistake is to model only the successful flow. A robust state diagram must account for timeouts, hardware failures, and invalid inputs. These often require transitions to an “Error” or “Recovery” state.
Maintaining the Model Over Time 📅
A state diagram is not a one-time artifact. As requirements change, the model must evolve. Keeping the model in sync with the code is a challenge.
Living Documentation
Regenerate the diagram from the code or update the code from the diagram. This practice, known as round-trip engineering, ensures that the documentation remains accurate. If the code changes behavior but the diagram does not, the model is obsolete.
Version Control
Since state diagrams are often complex, treat them as code. Store them in version control systems. This allows you to track who changed a transition and when, providing an audit trail for design decisions.
Practical Example: A Vending Machine 🥤
To illustrate the workflow, consider a simple Vending Machine system.
Requirements: 1. Machine starts in “Idle” state. 2. User inserts coin. Machine moves to “Ready”. 3. User selects item. Machine checks stock. 4. If stock available, dispense item and return to “Idle”. 5. If stock unavailable, return coin and stay in “Ready”.
Modeling Steps: 1. States: Idle, Ready, Dispensing, Error. 2. Events: InsertCoin, SelectItem, StockCheck, DispenseComplete, ReturnCoin. 3. Transitions: – Idle –InsertCoin–> Ready – Ready –SelectItem–> Dispensing (Guard: StockAvailable) – Ready –SelectItem–> Ready (Guard: !StockAvailable / ReturnCoin) – Dispensing –DispenseComplete–> Idle – Error –ReturnCoin–> Idle 4. Actions: Log transaction on entry to “Dispensing”. Play sound on entry to “Idle”.
This example demonstrates how simple requirements translate into a clear, executable model.
Conclusion on Best Practices 🏁
Building a UML State Machine Diagram is an exercise in clarity. It forces the team to think through every possible scenario before a single line of code is written. By adhering to a strict workflow, maintaining traceability, and avoiding common pitfalls, the resulting model becomes a powerful asset for development and testing.
Remember that the goal is not complexity for complexity’s sake. The diagram should simplify understanding of the system, not obscure it. When the model is clear, the implementation follows naturally. Use the diagram as a communication tool between stakeholders, designers, and developers to ensure a shared mental model of the system’s behavior.
Start with the requirements, define the states, map the transitions, and validate the logic. This disciplined approach leads to reliable, maintainable systems.