
When technical documentation grows organically without strict governance, visual representations often suffer the same fate as source code. Activity diagrams, intended to clarify workflows and logic, can quickly devolve into tangled webs of lines and nodes. This phenomenon, often called “spaghetti modeling,” creates significant friction for developers, analysts, and stakeholders trying to understand system behavior. Refactoring these diagrams is not merely an aesthetic exercise; it is a necessity for maintaining clarity, reducing cognitive load, and ensuring accurate communication across the development lifecycle.
This guide outlines a methodical approach to simplifying complex activity diagrams. We will explore identifying structural debt, applying specific reduction techniques, and establishing standards to prevent future complexity. The goal is to produce diagrams that serve their primary purpose: conveying information efficiently.
Understanding the Value of Refactoring 📉
Before diving into the mechanics of cleanup, it is essential to understand why a diagram might need intervention. A well-designed activity diagram acts as a single source of truth for process logic. When that logic becomes obscured, several negative outcomes occur:
- Reduced Readability: New team members struggle to trace paths through the diagram, leading to onboarding delays.
- Increased Error Risk: Complex flows increase the likelihood of missing edge cases during implementation.
- High Maintenance Cost: Updating a tangled diagram requires more time and attention than a structured one.
- Communication Barriers: Stakeholders may misinterpret the logic due to visual clutter.
Refactoring addresses these issues by restoring structure. It involves removing redundancy, clarifying decision points, and organizing the flow to match logical groupings rather than chronological or accidental connections.
Identifying Problematic Patterns 🔍
The first step in any refactoring effort is diagnosis. You cannot fix what you cannot see. Several patterns commonly indicate a diagram that requires attention. Recognizing these early allows you to target your efforts effectively.
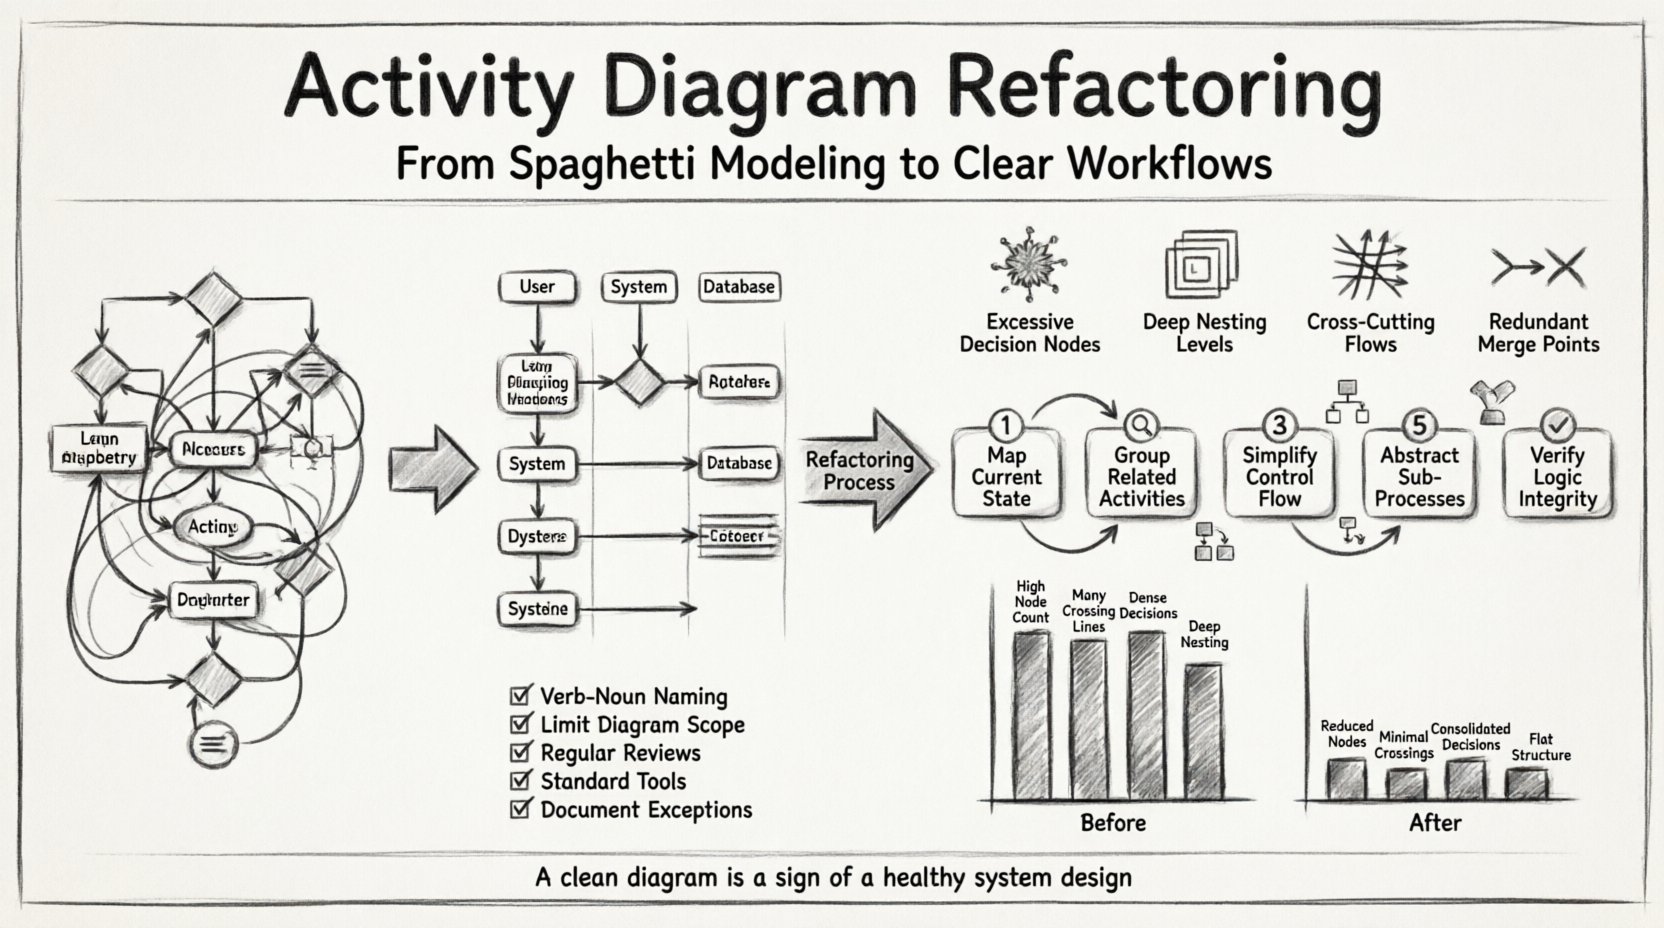
1. Excessive Decision Nodes
When a single activity branches into five or more paths, the diagram often becomes unreadable. While decision nodes are necessary for logic, a high density of them creates a “starburst” effect that distracts from the main flow. Look for nested decision nodes where the output of one decision immediately triggers another. This can usually be consolidated into a single decision with clearer guard conditions.
2. Deep Nesting Levels
Control flows that dive several layers deep without returning to the main thread are difficult to follow. This often happens when sub-activities are drawn inline rather than abstracted. Deep nesting forces the reader to scroll or jump back and forth mentally to understand the context.
3. Cross-Cutting Flows
Lines that crisscross the diagram horizontally or vertically without serving a clear purpose create visual noise. These often occur when parallel processes are not properly grouped. If a flow jumps over three other activities to connect two nodes, the diagram lacks local coherence.
4. Redundant Merge Points
Multiple merge nodes that perform the exact same function indicate a lack of abstraction. If three different paths all converge into a single activity, they should ideally merge at a single point to signify the completion of a phase.
Step-by-Step Refactoring Process 🛠️
Once the issues are identified, a structured approach ensures that logic is preserved while complexity is reduced. Follow these steps to systematically improve the diagram.
Step 1: Map the Current State
Do not attempt to change the diagram immediately. Create a list of all activities and their dependencies. Document the entry and exit points for every major section. This ensures that during the cleanup, no logical requirement is lost. Verify that every decision node has a corresponding exit path and that all loops are properly terminated.
Step 2: Group Related Activities
Organize activities into logical clusters. If a set of activities always occurs together, consider grouping them into a single sub-activity or using a separate diagram for that specific process. This technique reduces the cognitive load required to scan the main diagram.
- Identify Cohesive Blocks: Look for sequences that function as a single unit.
- Define Boundaries: Clearly mark where one block ends and another begins.
- Use Swimlanes: If the diagram involves multiple actors or systems, use swimlanes to separate responsibilities. This naturally reduces crossing lines.
Step 3: Simplify Control Flow
Review every arrow connecting two nodes. Ask if the connection is necessary. Sometimes, flows are drawn to show order but can be implied by the layout. Remove unnecessary arrows that do not carry specific logic or data.
- Consolidate Decisions: Merge adjacent decision nodes where possible. Use compound guard conditions instead of cascading checks.
- Eliminate Loops: Ensure loops are tight. If a flow returns to a decision node far away, check if the logic can be restructured to avoid the long return path.
- Standardize Symbols: Ensure all decision diamonds, action rectangles, and initial/final nodes follow the same visual standard.
Step 4: Abstract Sub-Processes
If a section of the diagram contains more than ten nodes, it is likely too detailed for the current context. Replace that section with a single activity node labeled “Sub-Process.” Create a separate activity diagram for that sub-process if the details are required elsewhere. This keeps the high-level view clean while preserving the detailed logic in a dedicated location.
Step 5: Verify Logic Integrity
After making changes, trace the flow from the start node to the final node. Ensure that all paths lead to a termination point and that no dead ends exist. Check that guard conditions cover all possibilities (e.g., if one path is “true,” the other should logically be “false” or “else”).
Comparing Complexity Metrics 📊
To measure the success of your refactoring, compare the diagram before and after using specific metrics. This data-driven approach helps justify the time spent on cleanup.
| Metric | Before Refactoring | After Refactoring | Goal |
|---|---|---|---|
| Node Count | High | Reduced | Remove redundancy |
| Crossing Lines | Many | Minimal | Improve readability |
| Decision Nodes | Dense | Consolidated | Clarify logic paths |
| Depth | Deep Nesting | Flat Structure | Reduce cognitive load |
| Swimlanes | Mixed | Organized | Separate concerns |
Notice how the goal is not necessarily to have zero nodes, but to have the right number of nodes to represent the logic clearly. Over-simplification can be just as detrimental as over-complication.
Best Practices for Maintenance 🛡️
Preventing the return of complexity is just as important as the initial cleanup. Implementing standards ensures that future diagrams remain maintainable.
1. Enforce Naming Conventions
Every activity node should have a clear, verb-noun label (e.g., “Validate User Input” rather than “Check”). Consistent naming helps users scan the diagram quickly without needing to read the fine print.
2. Limit Diagram Scope
One diagram should cover one logical process. If a diagram tries to cover the entire system workflow, it will inevitably become too large. Break the system down into manageable use cases or modules.
3. Regular Review Cycles
Include diagram reviews in the development lifecycle. When code changes occur, the corresponding diagram should be updated. This prevents the diagram from becoming a stale artifact that no longer matches reality.
4. Adopt a Standard Toolset
Ensure the team uses a consistent modeling environment. Different tools handle layout algorithms differently. A standardized environment ensures that alignment and spacing remain consistent across all project diagrams.
5. Document Exceptions
If a complex edge case cannot be avoided, document the reason in the diagram notes. This explains why a specific pattern exists, preventing confusion during future reviews.
Common Pitfalls to Avoid ⚠️
Even with the best intentions, refactoring can go wrong. Be mindful of these common mistakes.
- Over-Abstraction: Replacing too much logic with sub-activities can make the diagram useless for understanding specific flows. Find the balance between high-level overview and detailed implementation.
- Losing Context: When simplifying, ensure that critical data flows are not removed. An activity diagram often needs to show what data moves between steps, not just the control flow.
- Ignoring Parallelism: If the system runs processes in parallel, the diagram must reflect this using fork and join nodes. Flattening parallelism into a sequential list misrepresents the system architecture.
- Changing Logic During Cleanup: The goal of refactoring is to improve clarity, not to change behavior. Do not alter the logic unless it is demonstrably incorrect. Document any logic changes separately.
Advanced Techniques for Complex Systems 🔧
For very large systems, standard simplification may not be enough. Advanced techniques can help manage scale.
1. Hierarchical Decomposition
Use a top-down approach. Start with a high-level overview diagram showing the major phases. Then, create detailed diagrams for each phase. Link them together using references. This allows readers to drill down only when necessary.
2. Object Flow Separation
Distinguish clearly between control flow (when things happen) and object flow (what data moves). Sometimes, merging these flows creates confusion. If the diagram becomes cluttered with data objects, consider a separate sequence or data flow diagram for the data aspects.
3. Conditional Grouping
Use partitions or grouped regions to visually separate different conditions. If a large section of the diagram only applies when a specific condition is met, visually box that section to indicate its conditional nature.
Final Thoughts on Diagram Health 🌱
Maintaining clean activity diagrams is an ongoing process. It requires discipline and a commitment to clarity over convenience. By regularly refactoring and adhering to best practices, teams ensure that their visual documentation remains a reliable asset rather than a source of confusion.
The effort invested in simplifying a diagram pays dividends in reduced errors, faster onboarding, and clearer communication. Treat your diagrams with the same respect you give to your code. A clean diagram is a sign of a healthy system design.
Start your next refactoring session by selecting the most complex diagram in your repository. Apply the steps outlined above, measure the results, and share the improvements with your team. Small changes accumulate into significant improvements over time.