
Understanding the visual language of software design is a critical skill for any student entering the field of computer science or systems engineering. Among the various tools used to model behavior, the Activity Diagram stands out as a powerful method for describing the flow of control within a system. This guide provides a comprehensive breakdown of every standard symbol used in UML Activity Diagrams, ensuring you can read and create these models with clarity and precision. We will explore the meaning behind each shape, the logic they represent, and how they fit together to form a coherent narrative of system operations.
Whether you are mapping out a simple login process or designing a complex transaction system, knowing the correct notation is paramount. This resource focuses on the core elements without relying on specific software tools, keeping the focus purely on the logic and structure of the diagram itself. Let us begin by defining the foundational components that make up these diagrams.
What is an Activity Diagram? 📊
An Activity Diagram is essentially a flowchart used to model the dynamic aspects of a system. It describes the flow from one activity to another, showing the sequence of actions and the conditions under which they occur. Unlike a class diagram which shows static structure, an activity diagram shows how the system behaves over time. For students, mastering this notation helps in analyzing use cases and defining the detailed steps required to fulfill a specific function.
Key characteristics include:
- Focus on Flow: It tracks the movement of data or control from start to finish.
- Concurrency: It can show multiple activities happening at the same time using parallel threads.
- Decision Points: It highlights where the path diverges based on conditions.
- Swimlanes: It organizes activities by who or what is responsible for them.
Core Flow Objects: The Building Blocks 🧱
Every activity diagram starts with a specific set of nodes. These are the atomic units of the diagram. Misinterpreting these basic shapes can lead to confusion about the entire process flow. Below is a detailed breakdown of the primary nodes you will encounter.
1. Initial Node (Start Point) ⚫
The initial node represents the beginning of the activity flow. It is depicted as a solid black circle. There is typically only one initial node per diagram, although a diagram might be part of a larger system where the flow starts in different ways.
- Symbol: Filled black circle.
- Function: Marks where the process starts.
- Connections: Only outgoing edges are allowed; it cannot have incoming edges.
- Usage: Used to anchor the diagram so the reader knows exactly where to begin tracing the logic.
2. Final Node (End Point) 🔴
Conversely, the final node represents the successful termination of the activity. It is drawn as a solid black circle with a thick outer ring (bullseye style). A diagram may have multiple final nodes if there are multiple distinct ways for the process to end successfully.
- Symbol: Black circle with a thick border.
- Function: Marks the completion of the process.
- Connections: Only incoming edges are allowed; it cannot have outgoing edges.
- Usage: Indicates that a specific thread of control has reached its logical conclusion without errors.
3. Activity State (Action) ⬜
This is the workhorse of the diagram. An activity state represents a specific action or a step in the process. Visually, it looks like a rectangle with rounded corners. Inside the rectangle, you write the name of the activity, often as a verb phrase.
- Symbol: Rounded rectangle.
- Function: Represents a task, operation, or state.
- Connections: Can have both incoming and outgoing edges.
- Usage: Used for steps like “Validate User,” “Process Payment,” or “Generate Report.”
Control Flow and Edges 🔗
Connecting the nodes are the edges, also known as control flows. These lines indicate the sequence in which activities occur. Understanding the direction and labeling of these lines is crucial for accurate modeling.
- Directionality: Arrows on the lines indicate the direction of flow. Generally, flow moves from top to bottom or left to right.
- Unlabeled vs. Labeled: If a line has no label, it implies a default transition. If it passes through a decision node, the line must be labeled with a condition (e.g., “Yes,” “No,” “True,” “False”).
- Object Flow: Sometimes arrows represent the movement of data objects rather than just control. This is less common in basic activity diagrams but important for detailed data modeling.
Structural Elements: Organization and Scope 🏗️
As diagrams grow in complexity, they require structure to remain readable. Structural elements help divide the diagram into manageable sections.
1. Swimlanes (Partitions) 🏊
Swimlanes are a way to group activities based on responsibility. They are drawn as rectangular boxes that divide the diagram into horizontal or vertical strips. Each lane represents a different actor, such as a user, a specific system module, or a department.
- Benefit: Clarifies who is responsible for which action.
- Visual: A labeled rectangle that spans across the diagram.
- Usage: If a “Customer” submits a form and a “Server” processes it, placing these in separate lanes prevents confusion about which entity performs the action.
2. Activity Partition
Similar to swimlanes, partitions are often used interchangeably. They define the context for the activities contained within them. An activity can only exist within a specific partition. If an activity crosses a boundary, it implies a handoff between the actors defined by those boundaries.
Decision and Merge Logic 🔄
Real-world processes rarely follow a straight line. They involve choices, branches, and conditions. These elements are represented by specific geometric shapes.
1. Decision Node ⬥
A decision node acts like a diamond in a standard flowchart. It represents a point where the flow splits based on a condition. Exactly one outgoing edge will be taken, determined by the result of the evaluation.
- Symbol: Diamond shape.
- Input: Single incoming edge.
- Output: Two or more outgoing edges.
- Labels: Each outgoing edge must have a label indicating the condition (e.g., “Valid,” “Invalid”).
2. Merge Node ⬥
A merge node combines multiple incoming flows back into a single outgoing flow. It is visually identical to a decision node (a diamond), but its function is the opposite. It does not make a choice; it simply converges paths.
- Symbol: Diamond shape.
- Input: Two or more incoming edges.
- Output: Single outgoing edge.
- Usage: Used when different branches of logic (e.g., “Success” and “Retry”) eventually need to continue to the same subsequent step.
Concurrency and Parallelism ⚡
One of the most powerful features of activity diagrams is the ability to show simultaneous actions. This is handled through Fork and Join nodes.
1. Fork Node ⬜
A fork node splits a single incoming flow into multiple outgoing flows that occur simultaneously. It represents the start of parallel threads.
- Symbol: A short, thick horizontal bar (Fork).
- Function: Initiates concurrent activities.
- Output: Multiple outgoing edges.
- Usage: If a system needs to send an email and log an event at the same time, a fork node allows you to draw both paths originating from the same point.
2. Join Node ⬜
A join node waits for all incoming parallel flows to complete before allowing the single outgoing flow to proceed. It represents the synchronization point.
- Symbol: A short, thick horizontal bar (Join).
- Function: Synchronizes concurrent activities.
- Input: Multiple incoming edges.
- Output: Single outgoing edge.
- Usage: The system cannot proceed to the “Notify User” step until both the “Send Email” and “Log Event” steps are finished.
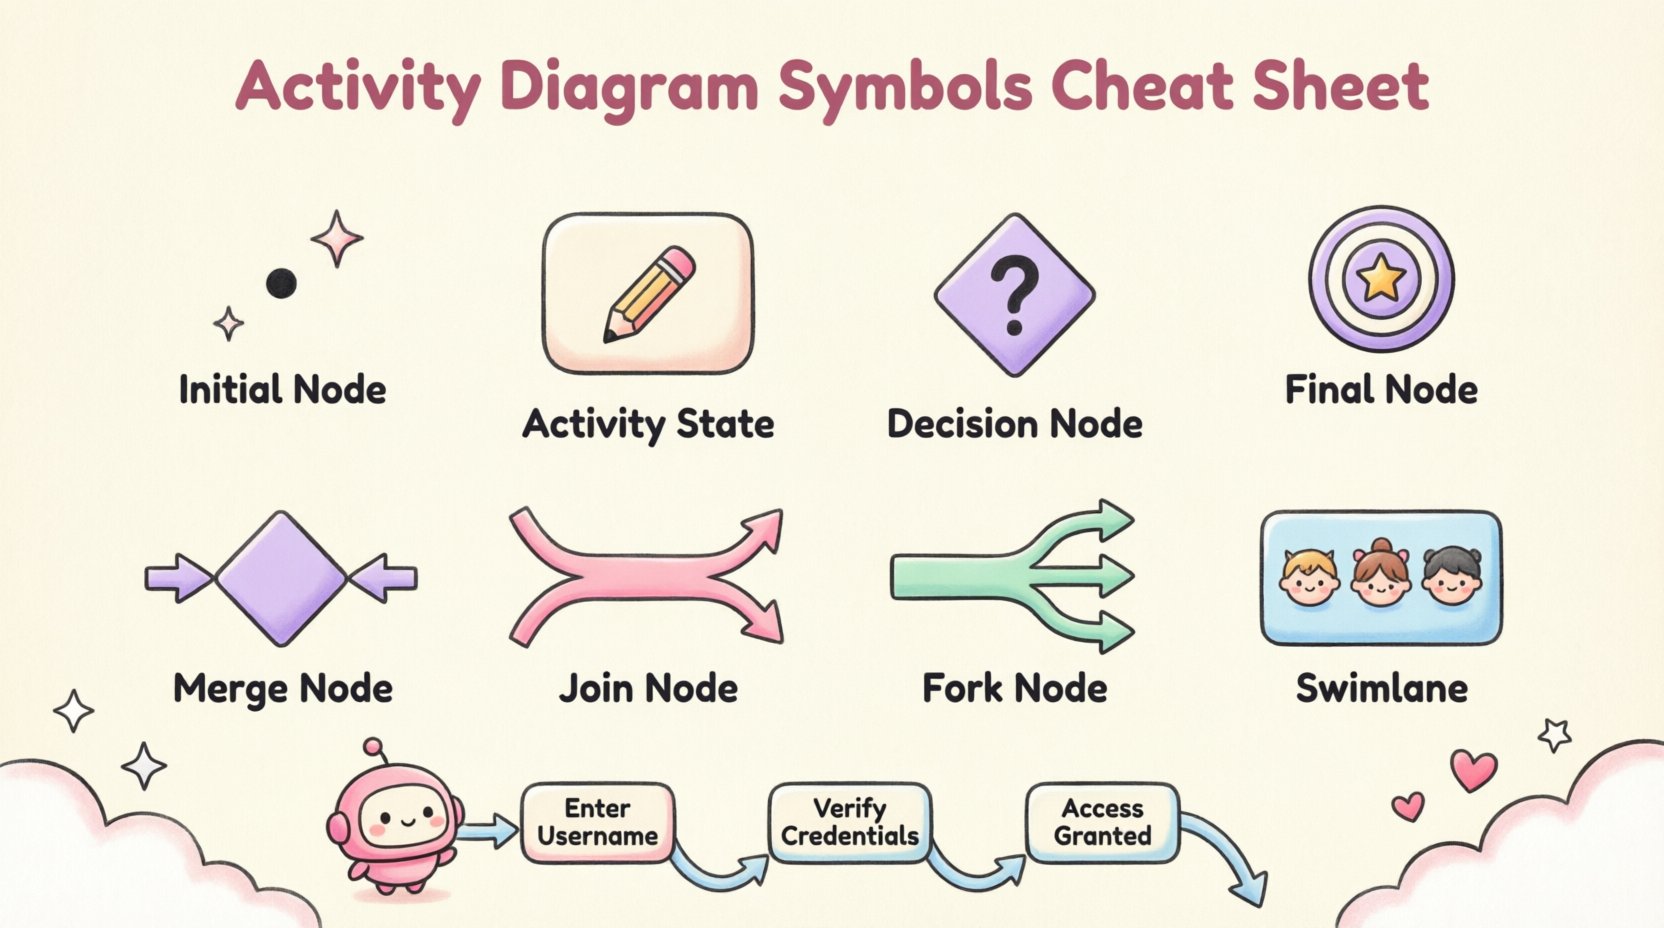
Quick Reference Table 📋
To aid your study, here is a consolidated table of the symbols discussed. This serves as a quick lookup while you are drafting your diagrams.
| Symbol Name | Visual Shape | Function | Input/Output |
|---|---|---|---|
| Initial Node | Filled Black Circle | Start of flow | 1 Out |
| Final Node | Bullseye Circle | End of flow | 1 In |
| Activity State | Rounded Rectangle | Action/Task | 1+ In / 1+ Out |
| Decision Node | Diamond | Conditional Branch | 1 In / 2+ Out |
| Merge Node | Diamond | Combine Paths | 2+ In / 1 Out |
| Fork Node | Thick Bar | Start Parallel | 1 In / 2+ Out |
| Join Node | Thick Bar | End Parallel | 2+ In / 1 Out |
| Swimlane | Rectangular Box | Group by Actor | N/A |
Advanced Considerations: Exceptions and Objects 📦
While the core nodes cover most scenarios, advanced diagrams often require handling exceptions or data objects explicitly.
1. Exception Handling
In many systems, errors must be handled gracefully. An activity diagram can show an exception handler using a specific edge type or a separate node. If an activity fails, the flow can divert to a handler node. This ensures that the diagram accounts for failure states, not just success paths. This is vital for students learning to design robust systems.
2. Object Flow
Standard activity diagrams focus on control (when things happen). Object flow diagrams focus on data (what things change). An object flow is represented by an arrow with a hollow arrowhead. It shows where an object is created, modified, or consumed. For example, a “Create Order” activity might produce an “Order Object” that flows into a “Process Payment” activity.
Common Mistakes to Avoid 🚫
Students often make specific errors when constructing these diagrams. Being aware of these pitfalls will save you time and confusion during your assignments.
- Disconnected Nodes: Ensure every node (except the final node) has an outgoing edge. A node with no exit is a dead end.
- Missing Labels: Never leave the edges coming out of a decision node unlabeled. The reader must know the condition for each path.
- Overlapping Swimlanes: Do not draw activities that span across swimlane boundaries unless it is explicitly a handoff. Keep actions within the lane of the responsible actor.
- Ignoring Concurrency: If two actions logically happen at the same time, do not draw them sequentially. Use fork and join nodes to represent true parallelism.
- Too Much Detail: Do not model every single click or database query. Keep the abstraction level appropriate for the audience. If it is a high-level design, do not include low-level implementation steps.
Best Practices for Clarity ✨
Creating a diagram is an art as much as a science. Follow these guidelines to ensure your work is professional and easy to understand.
1. Consistent Naming Conventions
Use verbs for activity states (e.g., “Submit Form” instead of “Form Submission”). This makes the flow read like a story. Ensure labels on decision edges are consistent (e.g., always use “Yes”/”No” or “True”/”False”, do not mix them).
2. Logical Layout
Try to draw the diagram from top to bottom or left to right without excessive crisscrossing of lines. If lines cross, use a “crossover” symbol or route them around to maintain readability. Avoid placing decision nodes so close together that the paths become tangled.
3. Use of Notes
If a specific condition or rule is complex, do not clutter the diagram with long text on the edges. Use a note object (a small rectangle with a folded corner) to attach detailed explanations to the relevant node or edge.
Activity Diagram vs. Flowchart 📝
It is common for students to confuse UML Activity Diagrams with standard flowcharts. While they look similar, there are distinct differences in their application and notation.
- Scope: Flowcharts are often used for algorithms and programming logic. Activity diagrams are used for business processes and system workflows.
- Concurrency: Standard flowcharts rarely show parallel execution. UML Activity Diagrams have built-in support for concurrency via Fork and Join nodes.
- Responsibility: Flowcharts do not typically distinguish between actors. Activity diagrams use swimlanes to explicitly define ownership of tasks.
- Standardization: Activity diagrams follow the UML standard, ensuring they can be understood by developers, analysts, and architects globally. Flowcharts can vary significantly in style.
Applying the Knowledge: A Scenario Example 💡
Let us apply these concepts to a simple scenario: A user attempts to log into a system.
- Start: Begin with an initial node.
- Input: Move to an activity state labeled “Enter Credentials”.
- Validation: Move to a decision node labeled “Valid Credentials?”.
- Branch 1: If “No”, move to “Show Error Message” and loop back to “Enter Credentials”.
- Branch 2: If “Yes”, move to a Fork node.
- Parallel: One path goes to “Log Access”. The other goes to “Display Dashboard”.
- Sync: Use a Join node to combine these paths.
- End: Move to a final node labeled “Session Active”.
This example demonstrates how the symbols work together to create a complete logic flow. Notice the loop in the error handling and the parallel processing of logging and display.
Final Thoughts on Notation 📚
Mastery of these symbols comes with practice. When reviewing your diagrams, ask yourself if the flow is intuitive. Does every path lead to a conclusion? Are the decision points clear? By adhering to the standard symbols and avoiding common pitfalls, you create documentation that serves as a reliable blueprint for development.
Remember that the goal is communication. The diagram is a tool to convey the logic of the system to others. Clarity should always take precedence over complexity. Use the swimlanes to organize responsibility, use the forks and joins to model concurrency, and use the decision nodes to map out logic paths. With this foundation, you are well-equipped to tackle complex system modeling tasks.
Keep this cheat sheet handy as you work through your projects. The more you practice drawing these flows, the more natural the notation will become. Focus on the logic first, and let the symbols be the vehicle for your expression.