
Activity diagrams serve as the backbone for visualizing the dynamic behavior of a system. They map out the flow from one activity to another, illustrating the logic, decisions, and interactions that define a process. To communicate these flows effectively, standardization is key. Understanding the specific symbols used in UML activity diagrams ensures that stakeholders, developers, and analysts share a common language. This guide provides a detailed breakdown of every essential component, ensuring your diagrams are clear, accurate, and functional.
Foundations of Activity Modeling 🏗️
Before diving into specific shapes, it is important to understand the two primary categories of elements: Nodes and Edges. Nodes represent actions, states, or objects. Edges represent the flow of control or data between these nodes. A well-structured diagram relies on a precise combination of these elements to prevent ambiguity. When constructing a model, clarity always takes precedence over complexity.
1. The Control Flow Nodes 🟢
Control flow nodes dictate the sequence of operations. They are the traffic signals of your diagram, telling the process where to go next.
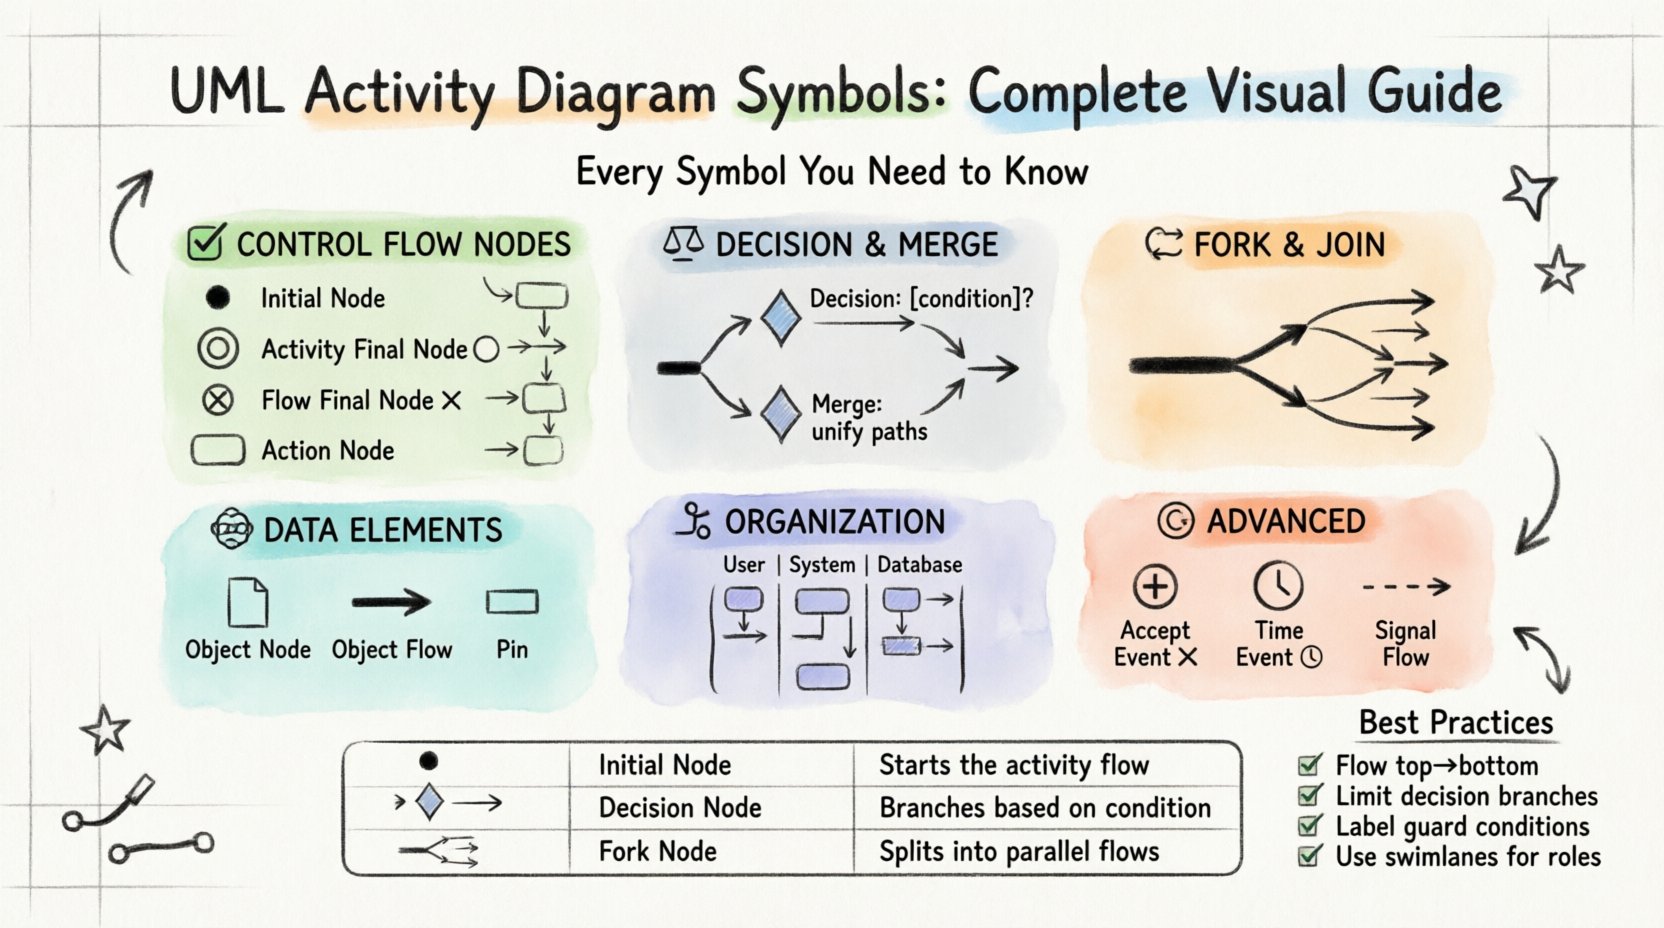
- Initial Node: This is the starting point of any activity diagram. It is depicted as a solid black circle ⚫. A diagram can have only one initial node. It signifies the trigger that begins the workflow. There are no incoming edges to this node.
- Activity Final Node: Represented by a bullseye symbol (a black circle with a smaller white circle inside) ⚪, this marks the successful termination of the entire activity. When control reaches this node, the process stops. It is the equivalent of a “Done” state.
- Flow Final Node: This is a solid black circle with a cross inside ⓧ. It indicates the termination of a specific flow without necessarily ending the entire activity. It is often used to signal an early exit from a branch of logic.
- Action Node: This is the core work unit. It is drawn as a rounded rectangle. An action node represents a step in the process, such as “Calculate Total” or “Validate Input.” It can be simple or detailed. If an action requires more depth, it can be refined into a sub-activity diagram.
2. Decision and Merge Logic ⚖️
Real-world processes are rarely linear. They involve choices. These symbols manage the branching paths within your workflow.
- Decision Node: Shown as a diamond shape 🔶, this element splits the control flow into multiple paths based on a condition. For example, a decision diamond might ask, “Is Payment Approved?” Only one outgoing edge will be taken. Each path must have a guard condition (a boolean expression) written next to the edge to specify when that path is valid.
- Merge Node: Also a diamond shape 🔶, but its purpose is to combine flows. It is the inverse of a decision node. Multiple incoming paths converge here, and the control flow continues on a single outgoing path. Unlike a decision, a merge node does not add logic; it simply unifies the branches.
Note: In standard UML, the decision and merge nodes use the same symbol. The context of the incoming and outgoing edges clarifies their function.
3. Concurrency and Parallelism 🔄
Systems often perform multiple tasks simultaneously. Activity diagrams handle this through fork and join constructs.
- Fork Node: Represented by a thick black horizontal or vertical bar —, this splits a single incoming flow into multiple parallel flows. It indicates that the subsequent activities can happen at the same time. This is crucial for modeling multi-threaded processes or team-based workflows.
- Join Node: Also a thick black bar —, this merges multiple parallel flows back into a single flow. The join node waits for all incoming paths to complete before allowing the control flow to proceed. This ensures synchronization. If one path is slower than the others, the flow pauses at the join node.
Data Flow and Object Representation 📦
While control nodes manage the “when” and “how,” object nodes manage the “what”. They represent the data moving through the system.
- Object Node: Drawn as a rectangle with a folded corner (resembling a page) 📄. This node holds an instance of a class or a data structure. For example, an object node might represent a “Customer Order” or a “Calculation Result.” Unlike action nodes, object nodes do not perform actions; they store state.
- Object Flow: This is a directed edge that carries objects between action nodes or object nodes. It is drawn as a solid line with an arrowhead. Object flows indicate that an action produces an object that is then consumed by the next action. This is distinct from control flow, which indicates logical sequencing.
- Pin: Pins are small rectangles attached to the side of an action node. They represent the input or output parameters of an action. A pin can be typed (specifying the data type) or untyped. They help define the contract of the action without cluttering the main shape.
Organizing Complexity: Swimlanes and Partitions 🏊
As diagrams grow, they become difficult to read. Swimlanes provide a way to organize activities by responsibility or category.
- Partition (Swimlane): A partition is a region that groups a set of activities. It is drawn as a rectangle with a label at the top. The label usually represents an actor, a department, or a system component. By placing actions inside specific swimlanes, you clarify who or what is responsible for that step.
- Pool: A pool is a top-level partition that can contain multiple swimlanes. It often represents a distinct entity or system boundary. Interactions between pools are critical in sequence modeling, though in activity diagrams, pools primarily serve to separate distinct workflows.
Using swimlanes effectively prevents the “spaghetti diagram” effect. It allows readers to trace the path of a specific actor without getting lost in unrelated activities.
Advanced Interactions and Events ⏱️
Complex systems require more than just linear logic. They need to respond to external triggers.
- Accept Event: This node allows the activity to wait for an external signal or condition. It is depicted as a circle with a plus sign inside ⨁. It is often used in event-driven architectures where the system must pause and listen for input before proceeding.
- Signal Flow: This edge connects an action node to an accept event node. It represents the transmission of a signal. Unlike object flow, signal flow is asynchronous and does not block the sending action.
- Time Event: Represented by a clock icon ⏰, this node indicates that an action occurs after a specific duration or at a specific time. It is useful for scheduling tasks, timeouts, or periodic checks.
Reference Guide: Symbols at a Glance 📋
To assist with quick reference, the following table summarizes the primary symbols and their meanings.
| Symbol Name | Visual Representation | Function |
|---|---|---|
| Initial Node | ⚫ Black Circle | Start of the activity |
| Activity Final Node | ⚪ Bullseye | Successful end of process |
| Flow Final Node | ⓧ Black Circle with Cross | Termination of a specific flow |
| Action Node | Rounded Rectangle | Performing a task or step |
| Decision Node | 🔶 Diamond | Branching based on conditions |
| Join/Fork Node | — Thick Bar | Parallel splitting or merging |
| Object Node | 📄 Page Icon | Holding data or state |
| Swimlane | Labelled Rectangle | Grouping by responsibility |
Best Practices for Diagramming ✍️
Creating a diagram is an art as much as it is a science. Adhering to these guidelines will improve the quality of your documentation.
1. Maintain Flow Direction
Always design your diagrams to flow from top to bottom or left to right. Avoid crossing lines where possible. If lines must cross, use “jumps” or “bridges” to indicate they do not connect. Consistent direction reduces cognitive load for the reader.
2. Limit Decision Complexity
A decision node should ideally have no more than three or four outgoing edges. If a decision requires more, consider breaking it down into multiple decision nodes or using a structured conditional block. Too many branches lead to confusion.
3. Define Guard Conditions Clearly
Every edge leaving a decision node should have a guard condition. Use clear boolean expressions like [isApproved] or [amount > 100]. If a condition is not met, the flow should naturally default to a specific path or indicate an error.
4. Balance Control and Object Flows
Do not mix control flow and object flow on the same edge. Control flow dictates order. Object flow dictates data transfer. Mixing them obscures the logic. If an action needs data to proceed, show the object flow entering the action node.
5. Use Swimlanes for Roles
Whenever multiple actors are involved, use swimlanes. This separates the workflow by role (e.g., User, System, Database). It makes it immediately clear who performs which action.
Understanding Flow Types 🌊
Distinguishing between the types of edges is vital for accurate modeling. The table below outlines the differences.
| Flow Type | Symbol | Purpose | Direction |
|---|---|---|---|
| Control Flow | Solid Line with Arrow | Sequencing logic | One way |
| Object Flow | Solid Line with Arrow | Data movement | One way |
| Signal Flow | Dashed Line with Arrow | Asynchronous events | One way |
| Exception Flow | Red Line | Error handling | One way |
Common Pitfalls to Avoid 🚫
Even experienced modelers can fall into traps that degrade the quality of the diagram. Be vigilant against these common errors.
- Orphaned Nodes: Ensure every node (except the initial) has at least one incoming edge. Ensure every node (except the final) has at least one outgoing edge. Isolated nodes indicate broken logic.
- Deadlocks: Avoid creating loops where no path can exit. This happens when a join node waits for a fork that never completes. Always verify that every parallel path converges.
- Overly Detailed Actions: If an action node requires a paragraph of text to explain, it is likely too complex. Break it down into a sub-activity diagram.
- Inconsistent Naming: Use consistent naming conventions for nodes and edges. “Process Data” and “Process Input” should not be used interchangeably if they refer to the same step.
Final Thoughts on Modeling 🎯
Activity diagrams are tools for communication, not just documentation. Their value lies in how well they convey the intended behavior of a system to the team. By mastering the symbols and adhering to structural best practices, you create models that are robust and understandable. Remember that a diagram is a living artifact; it should evolve as the system requirements change. Regular reviews ensure that the model remains accurate over time.
Focusing on clarity, consistency, and standard symbols ensures that your diagrams serve their purpose effectively. Whether you are mapping a simple user login or a complex financial transaction, these components provide the necessary framework for success.