
Creating clear system architecture requires precision. When mapping object interactions, a communication diagram provides a snapshot of how components work together. Selecting the correct platform impacts how effectively your team documents, maintains, and understands these relationships. This guide examines the essential criteria for evaluating modeling software without bias toward specific vendors.
🧩 Understanding Communication Diagrams
Communication diagrams, formerly known as collaboration diagrams, visualize the structural organization of objects and the messages exchanged between them. Unlike sequence diagrams, which focus heavily on the chronological order of events, communication diagrams emphasize the spatial relationships and links between objects.
Key characteristics include:
- Object Roles: Distinct entities participating in the interaction.
- Links: Connections representing associations between objects.
- Messages: Signals sent from one object to another.
- Sequence Numbers: Indicators of message order (e.g., 1, 1.1, 2).
When choosing a tool, you must ensure it supports these specific semantic elements natively. A platform that treats these merely as text boxes or shapes will hinder the clarity of your models.
🛠️ Core Functional Requirements for Modeling
The software you select must handle the technical nuances of interaction modeling. Basic drawing capabilities are insufficient for professional system design.
1. Object and Link Management
Communication diagrams rely on explicit links. Your tool should allow you to:
- Create named links between objects.
- Define multiplicity (e.g., one-to-many relationships).
- Drag and drop objects while maintaining link integrity.
- Group objects to represent subsystems or modules.
2. Message Flow Visualization
Messages must be clearly distinguishable from links. Look for a platform that supports:
- Directed arrows for message direction.
- Labeling capabilities for method names and parameters.
- Color coding to differentiate synchronous vs. asynchronous calls.
- Annotation fields for additional context on specific interactions.
3. Navigation and Zooming
As diagrams grow, navigation becomes critical. Effective tools offer:
- Smooth pan and zoom without loss of resolution.
- Outline views to jump between sections.
- Focus modes to highlight specific message paths.
- Automatic layout adjustments when objects are moved.
👥 Collaboration and Team Dynamics
Modern development is rarely solitary. Your diagramming solution must facilitate teamwork without introducing friction.
Real-Time Co-Editing
Multiple stakeholders often review architecture simultaneously. A robust tool enables:
- Live cursor tracking for active collaborators.
- Instantaneous updates without manual refreshes.
- Conflict resolution mechanisms if two users edit the same element.
Comments and Annotations
Diagrams often require explanation beyond the visual elements. Essential features include:
- Threaded comments linked to specific objects or links.
- Comment history to track decisions.
- Notification systems to alert team members of changes.
- Tagging capabilities to assign tasks to specific roles.
Access Control
Not everyone needs to edit the model. Security settings should allow:
- Role-based access (Viewer, Editor, Admin).
- Project-level permissions.
- Integration with existing identity providers.
🔄 Integration with Development Workflows
Documentation should not exist in a vacuum. The tool must integrate with your existing tech stack.
Export Capabilities
Sharing diagrams with non-technical stakeholders requires standard formats. Verify support for:
- Image Formats: PNG, SVG, and PDF for presentations.
- Document Formats: HTML and Markdown for wikis.
- Data Formats: XML or JSON for backup and migration.
Version Control
Architecture evolves. You need a system that tracks changes over time.
- Automatic saving of revisions.
- Ability to revert to previous states.
- Difference highlighting to see what changed.
- Branching support for experimental designs.
API and Automation
For advanced workflows, programmatic access is beneficial.
- RESTful APIs to generate diagrams via script.
- CLI tools for batch processing.
- Webhooks to trigger actions when diagrams update.
- Plugins for IDE integration.
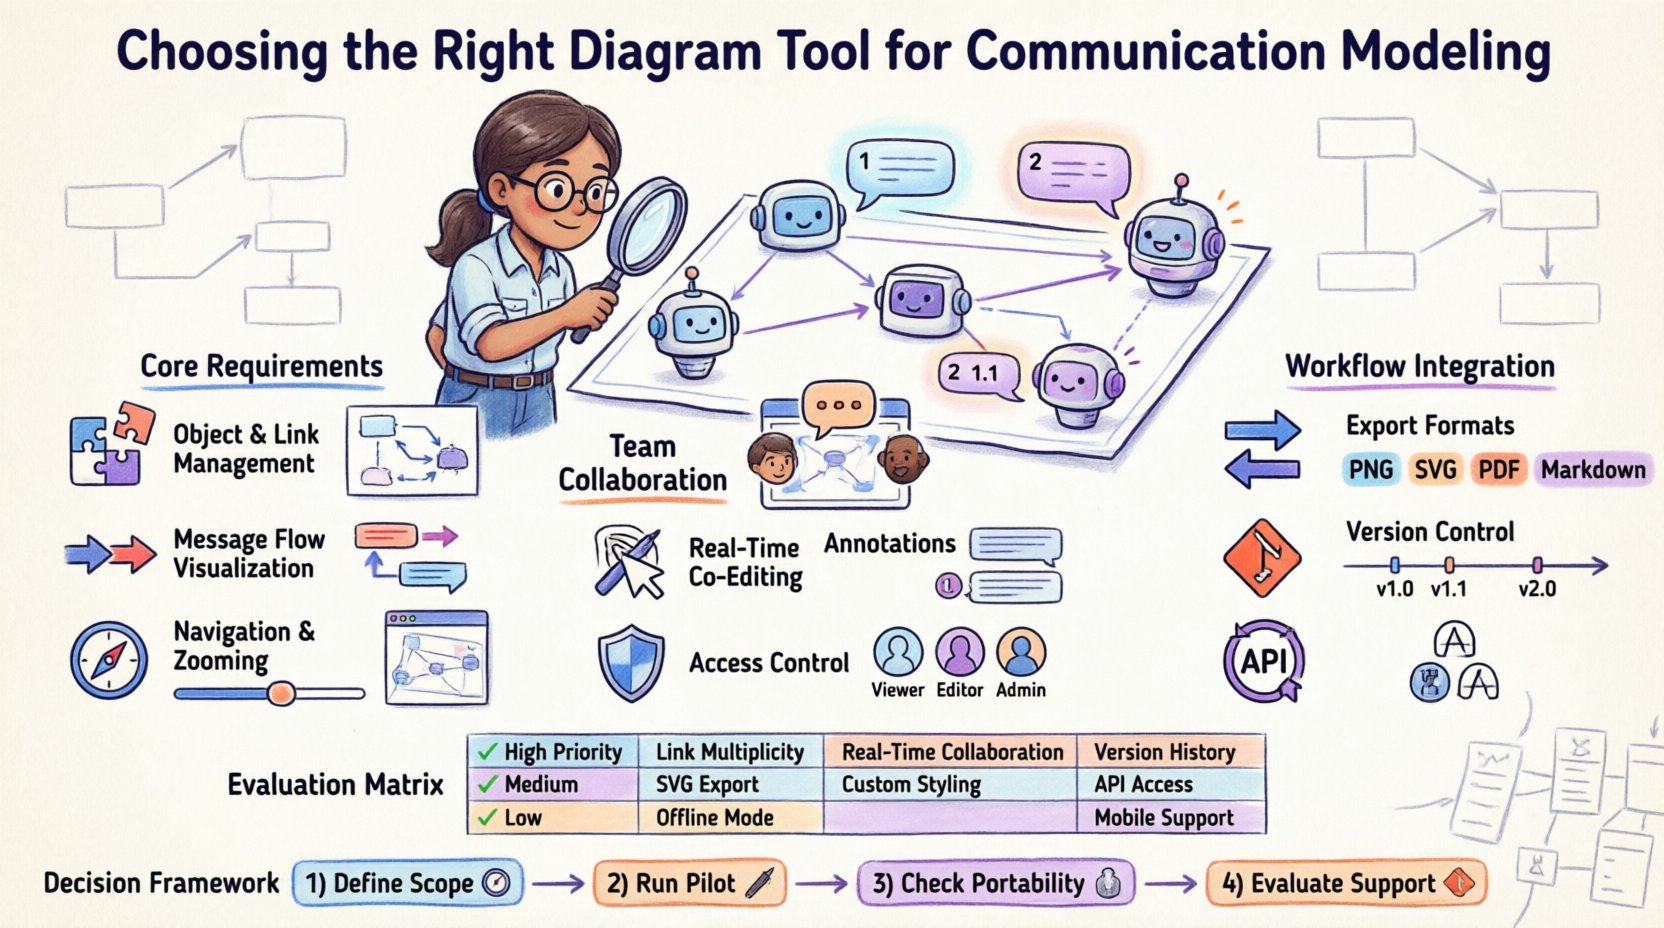
📋 Evaluation Criteria Matrix
Use this table to compare potential platforms against your project needs.
| Feature | Importance | Why It Matters |
|---|---|---|
| Link Multiplicity | High | Ensures accurate representation of relationships. |
| Real-Time Collaboration | High | Reduces sync time between architects and developers. |
| SVG Export | Medium | Allows for scalable graphics in documentation. |
| Version History | High | Protects against accidental data loss. |
| Offline Mode | Low | Useful for remote work or connectivity issues. |
| Custom Styling | Medium | Aligns diagrams with corporate branding. |
| API Access | Medium | Enables automation in CI/CD pipelines. |
| Mobile Support | Low | Good for reviewing on the go, less for editing. |
📈 Maintenance and Long-Term Viability
Tools are investments. Consider how easy it is to maintain the models over years.
Refactoring Support
Code changes often require diagram updates. A good tool minimizes manual effort:
- Snap-to-grid functionality for alignment.
- Auto-layout options to reorganize cluttered views.
- Search and replace for object names across the model.
- Template systems to standardize diagram styles.
Scalability
Small projects differ from enterprise systems. Check performance limits:
- Maximum number of objects per canvas.
- Rendering speed with large datasets.
- Clustering capabilities to hide detail.
- Sub-diagram nesting for complexity management.
Learning Curve
Adoption speed affects productivity.
- Availability of interactive tutorials.
- Documentation quality for advanced features.
- Community support forums.
- Standardized icon sets that match UML conventions.
💰 Cost and Licensing Models
Budget constraints are real. Analyze the pricing structure carefully.
Per-User vs. Per-Seat
Some models charge for every editor, while others charge for the project.
- Per-User: Better for small teams with stable size.
- Per-Project: Better for large organizations with many users.
Open Source vs. Proprietary
Open source offers freedom but requires self-hosting.
- Proprietary: Easier setup, regular updates, support included.
- Open Source: No license fees, community support, customization possible.
Hidden Costs
Beware of fees not immediately visible.
- Storage limits for file archives.
- Cost for premium support tiers.
- Pricing for additional integrations.
- Upgrade costs for new feature sets.
✅ Making the Final Decision
Choosing the right software involves balancing features, cost, and workflow fit.
1. Define Your Scope
List the non-negotiable features. If you need API access, a basic drawing tool is insufficient. If you need offline access, cloud-only options are risky.
2. Run a Pilot
Test the top three candidates with a real project.
- Model a complex interaction scenario.
- Invite a colleague to collaborate.
- Export the result to your documentation system.
- Measure the time taken to complete the task.
3. Check Data Portability
Ensure you own your data.
- Can you export the model to a standard format?
- Is there an API to retrieve the diagram data?
- What happens if the vendor changes pricing?
4. Evaluate Support
When issues arise, help is necessary.
- Response time for support tickets.
- Availability of knowledge base articles.
- Community activity levels.
🔧 Final Thoughts on Implementation
The goal of modeling is clarity. A tool that complicates the process defeats the purpose. By focusing on object management, collaboration features, and integration capabilities, you can select a platform that supports your architecture needs effectively.
Remember that the best tool is the one your team will actually use consistently. Prioritize ease of use alongside advanced functionality. Regularly review your chosen solution to ensure it still meets your evolving requirements. Continuous improvement in your documentation process leads to better system design and fewer misunderstandings during development.
Invest time in setting up standards early. Define naming conventions, link styles, and message formats before the project begins. This discipline ensures that diagrams remain readable as the system grows. With the right tool and process in place, communication diagrams become a powerful asset for your engineering team.