
Understanding how different parts of a software system interact is fundamental to building robust applications. For students entering the field of computer science and software engineering, visualizing these interactions can be challenging. One of the most effective tools for this purpose is the communication diagram. This guide provides a detailed look at what these diagrams are, how to construct them, and why they matter in the design process. We will explore the structure, components, and best practices without relying on specific software tools.
What is a Communication Diagram? 🤔
A communication diagram, formerly known as a collaboration diagram, is a type of Unified Modeling Language (UML) diagram. It focuses on the interaction between objects and the messages passed between them. Unlike other diagrams that emphasize the chronological order of events, this diagram emphasizes the structural organization of the objects involved.
Imagine a scenario where a user places an order in an online store. Several components must work together: the user interface, the order processor, the inventory system, and the payment gateway. A communication diagram maps out these connections. It shows which objects talk to which other objects and in what sequence.
Key characteristics include:
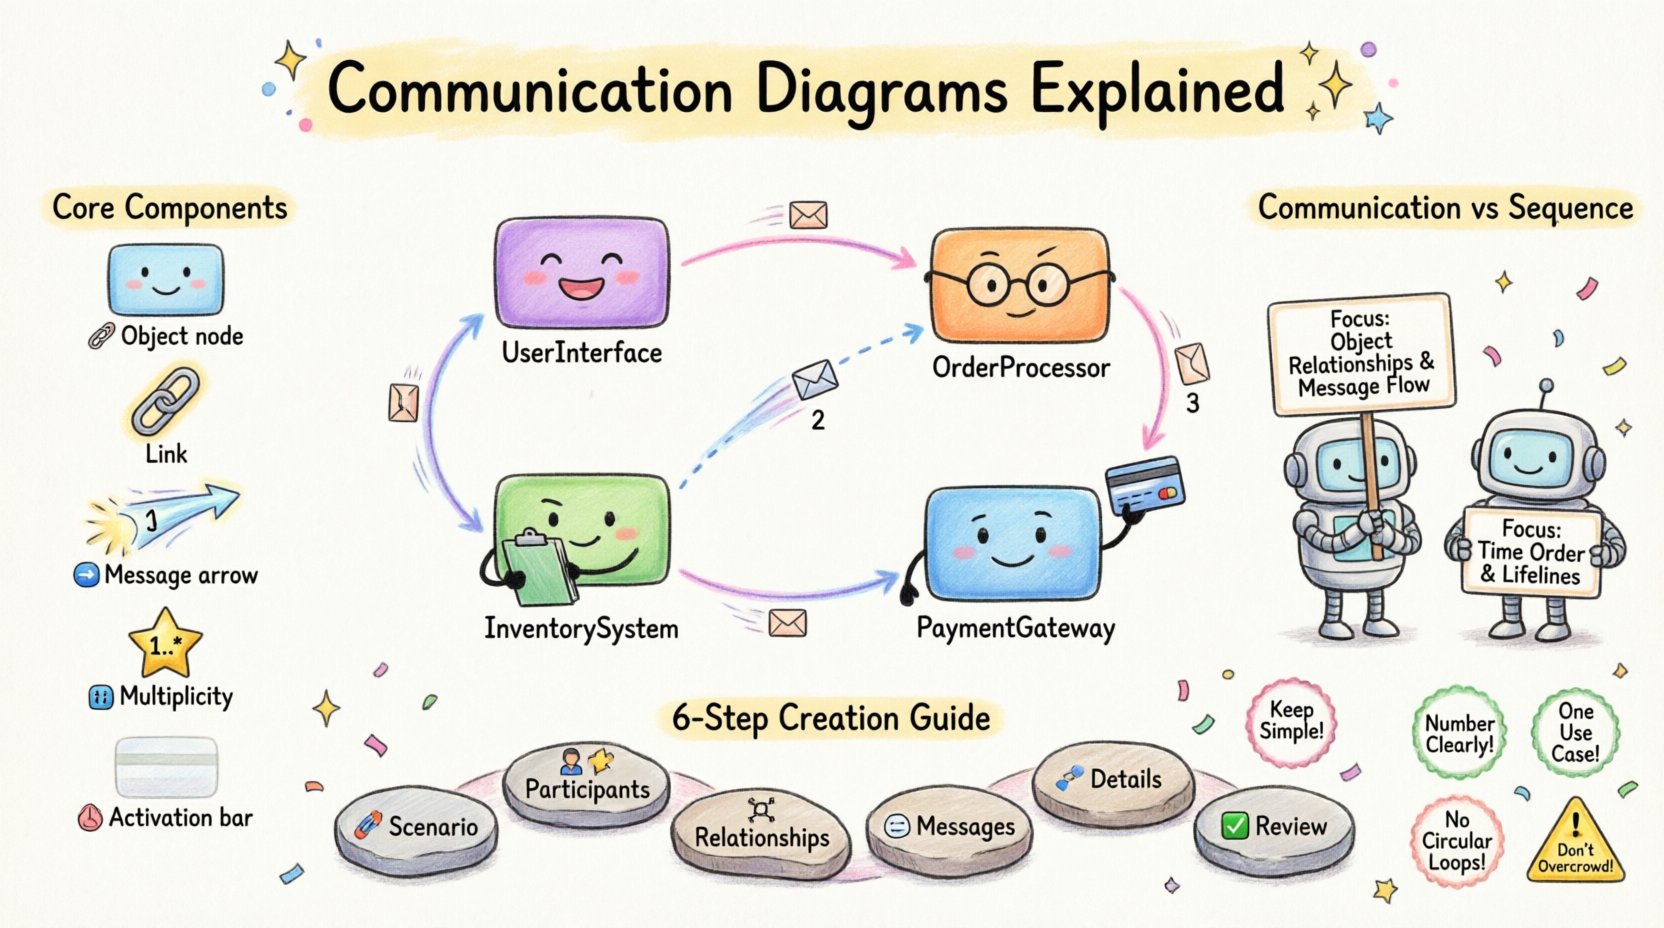
- Focus on Objects: It highlights the instances of classes that participate in the interaction.
- Focus on Links: It displays the connections (links) between objects.
- Focus on Messages: It numbers the messages to show the sequence of communication.
- Visual Structure: It arranges objects spatially to reflect their relationships.
This type of diagram is particularly useful when the focus is on the relationships between objects rather than the timing of events. It complements other diagrams, such as sequence diagrams, by providing a different perspective on the same interaction.
Core Components of the Diagram 🧩
To create a clear and effective diagram, you must understand the building blocks. Each element serves a specific purpose in conveying information about the system architecture.
1. Objects (Nodes) 🟦
Objects represent instances of classes. In the diagram, they appear as rectangles. Each object is typically labeled with the class name followed by a colon and the instance name (e.g., OrderProcessor: order1). This distinction is important because it clarifies that we are looking at specific data, not just the blueprint for that data.
2. Links (Associations) 🔗
Links are the lines connecting the objects. They represent the relationships between objects, such as associations or references. A link must exist for one object to send a message to another. If there is no direct link between two objects, one cannot call a method on the other directly.
3. Messages (Arrows) ➡️
Messages represent the interactions. They are drawn as arrows pointing from the sender to the receiver. Each message must have a unique number to indicate the order of execution. The number is placed near the arrowhead.
4. Multiplicity (Cardinality) 🔢
Multiplicity describes how many instances of an object can be involved in the relationship. For example, a single user might place many orders. This is often represented by a star (*) or a specific number near the link line.
5. Activation Bars (Optional) ⏳
Sometimes, vertical bars are drawn on the object to show when the object is actively processing a message. While more common in sequence diagrams, they can appear here to indicate processing duration.
Comparison: Communication vs. Sequence Diagrams 🆚
Students often confuse communication diagrams with sequence diagrams because both deal with object interactions. Understanding the differences helps in choosing the right tool for the job.
| Feature | Communication Diagram | Sequence Diagram |
|---|---|---|
| Primary Focus | Object relationships and structure | Time sequence and flow |
| Layout | Organized by spatial relationships | Organized by vertical time axis |
| Message Order | Indicated by numbered arrows | Indicated by vertical position |
| Complexity | Can get cluttered with many objects | Handles many objects well |
| Use Case | Overview of connections | Detailed step-by-step logic |
While sequence diagrams are excellent for tracing logic flow from start to finish, communication diagrams provide a better overview of the system’s topology. They answer the question: “Which objects need to talk to each other?” rather than “When does it happen?”
Step-by-Step Guide to Creating a Diagram 🛠️
Creating a communication diagram involves a logical progression. Follow these steps to ensure accuracy and clarity.
Step 1: Identify the Scenario 🎬
Start by defining the specific use case you want to model. Is it a login process? A data retrieval request? A payment transaction? Narrowing the scope prevents the diagram from becoming too complex. Write down the goal of the interaction.
Step 2: List the Participants 👥
Identify all the objects involved in this scenario. These are the classes that hold the state or perform the actions. Write them down. Do not include every class in the system, only those relevant to this specific flow.
Step 3: Determine Relationships 🕸️
Draw links between the objects identified in the previous step. Ask yourself: “Does object A know about object B?” If yes, draw a line. This establishes the pathway for messages to travel.
Step 4: Map the Messages 📩
Decide the order of operations. Who initiates the interaction? Trace the path of the data. Draw arrows for each message. Assign a sequential number to each arrow (1, 1.1, 1.2, 2, etc.).
Step 5: Define Message Details 📝
Add labels to the arrows. Specify the method name being called. You can also indicate return messages using dashed lines if necessary. Be precise with naming conventions to match the code.
Step 6: Review and Validate ✅
Check the diagram against the requirements. Ensure all links are necessary. Ensure the message numbers reflect the actual logic flow. Ask a peer to review it for clarity. This step ensures the diagram accurately represents the design.
Best Practices for Clarity 🌟
To make your diagrams useful to other developers and stakeholders, adhere to these guidelines.
- Keep it Simple: Avoid cramming too many objects into one diagram. If a scenario is complex, break it into multiple diagrams.
- Consistent Naming: Use standard naming conventions for objects and methods. This reduces confusion.
- Logical Layout: Arrange objects so that the arrows flow logically, ideally from left to right or top to bottom.
- Numbering System: Use a clear numbering system. Use decimals (1.1, 1.2) for nested messages within a parent message.
- Limit Scope: Focus on one use case per diagram. This keeps the diagram readable.
- Use Labels: Label your objects clearly. Avoid generic names like “Object 1” unless you are unsure of the class name.
Common Pitfalls to Avoid ⚠️
Even experienced designers make mistakes. Being aware of common errors can save time during the review process.
- Circular Dependencies: Ensure you do not create loops where Object A calls Object B, which immediately calls Object A again, without end. This can indicate a design flaw.
- Missing Links: Never draw an arrow between two objects without a connecting line. This violates the rules of object interaction.
- Overcrowding: If the diagram looks like a spider web, you have too many objects. Split the interaction into smaller chunks.
- Inconsistent Timing: Do not mix time-based logic with structural logic. Keep the sequence numbers accurate to the flow, not the clock time.
- Ignoring Multiplicity: Failing to note if one object relates to many others can lead to misunderstandings about data volume.
Real-World Application Scenarios 💼
Where do these diagrams fit in the software development lifecycle? They are valuable in several contexts.
1. System Analysis 📋
During the analysis phase, architects use these diagrams to understand the high-level connections. They help identify critical dependencies between modules.
2. Documentation 📚
For new team members, these diagrams serve as a map. They explain how different parts of the codebase connect without needing to read every line of code.
3. Debugging 🐞
When a bug occurs in a multi-step process, the diagram helps trace the path of data. It highlights where the interaction might have failed.
4. Training 👨🏫
Students learning object-oriented design use them to visualize abstract concepts. They make the invisible connections visible.
Understanding Message Types 📡
Not all messages are the same. Understanding the types helps in modeling the behavior accurately.
- Synchronous: The sender waits for the receiver to finish the task before continuing. This is the standard assumption unless noted otherwise.
- Asynchronous: The sender sends the message and continues immediately. This is often used for logging or background tasks.
- Return Message: The response from the receiver back to the sender. Often shown with a dashed line.
- Signal: A message that is sent without expecting a return value. Common in event-driven systems.
Advanced Considerations 🚀
As you advance in your studies, you will encounter more complex scenarios.
Handling Loops and Conditions
Real-world logic involves loops and conditions. In a communication diagram, you can annotate the arrow to indicate “if X, then Y.” You might label a message as “for each item” to indicate a loop.
Exception Handling
What happens if an error occurs? While diagrams can get messy with error paths, it is good practice to note where exceptions are caught. This shows the robustness of the design.
Performance Implications
Each message adds overhead. If you see a diagram with hundreds of messages between two objects, it might indicate poor design. High coupling can lead to performance bottlenecks.
Final Thoughts on Visual Design 🎨
Creating a communication diagram is a skill that improves with practice. It requires a balance between technical accuracy and visual clarity. The goal is not just to draw lines, but to communicate the logic of the system effectively.
By mastering the elements of objects, links, and messages, you gain a powerful tool for software design. It helps you see the forest and the trees simultaneously. Remember to keep your diagrams clean, use consistent notation, and focus on the relationships that matter most.
As you progress in your studies, you will find that these diagrams are essential for collaboration. They bridge the gap between abstract requirements and concrete code. Use them to clarify your thinking and to explain your design to others. With patience and practice, you will become proficient in creating diagrams that are both accurate and easy to understand.
Keep refining your approach. Look at diagrams created by others. Analyze what works and what does not. Apply the lessons learned to your own projects. The ability to visualize system interactions is a core competency for any software professional.