
Modeling software systems requires more than just writing code; it demands a clear visualization of how different parts interact. Among the various Unified Modeling Language (UML) tools available, the Communication Diagram stands out as a vital instrument for understanding dynamic behavior. This guide explores the intricacies of creating these diagrams, moving from theoretical foundations to practical application.
Understanding the Core Concept 🤔
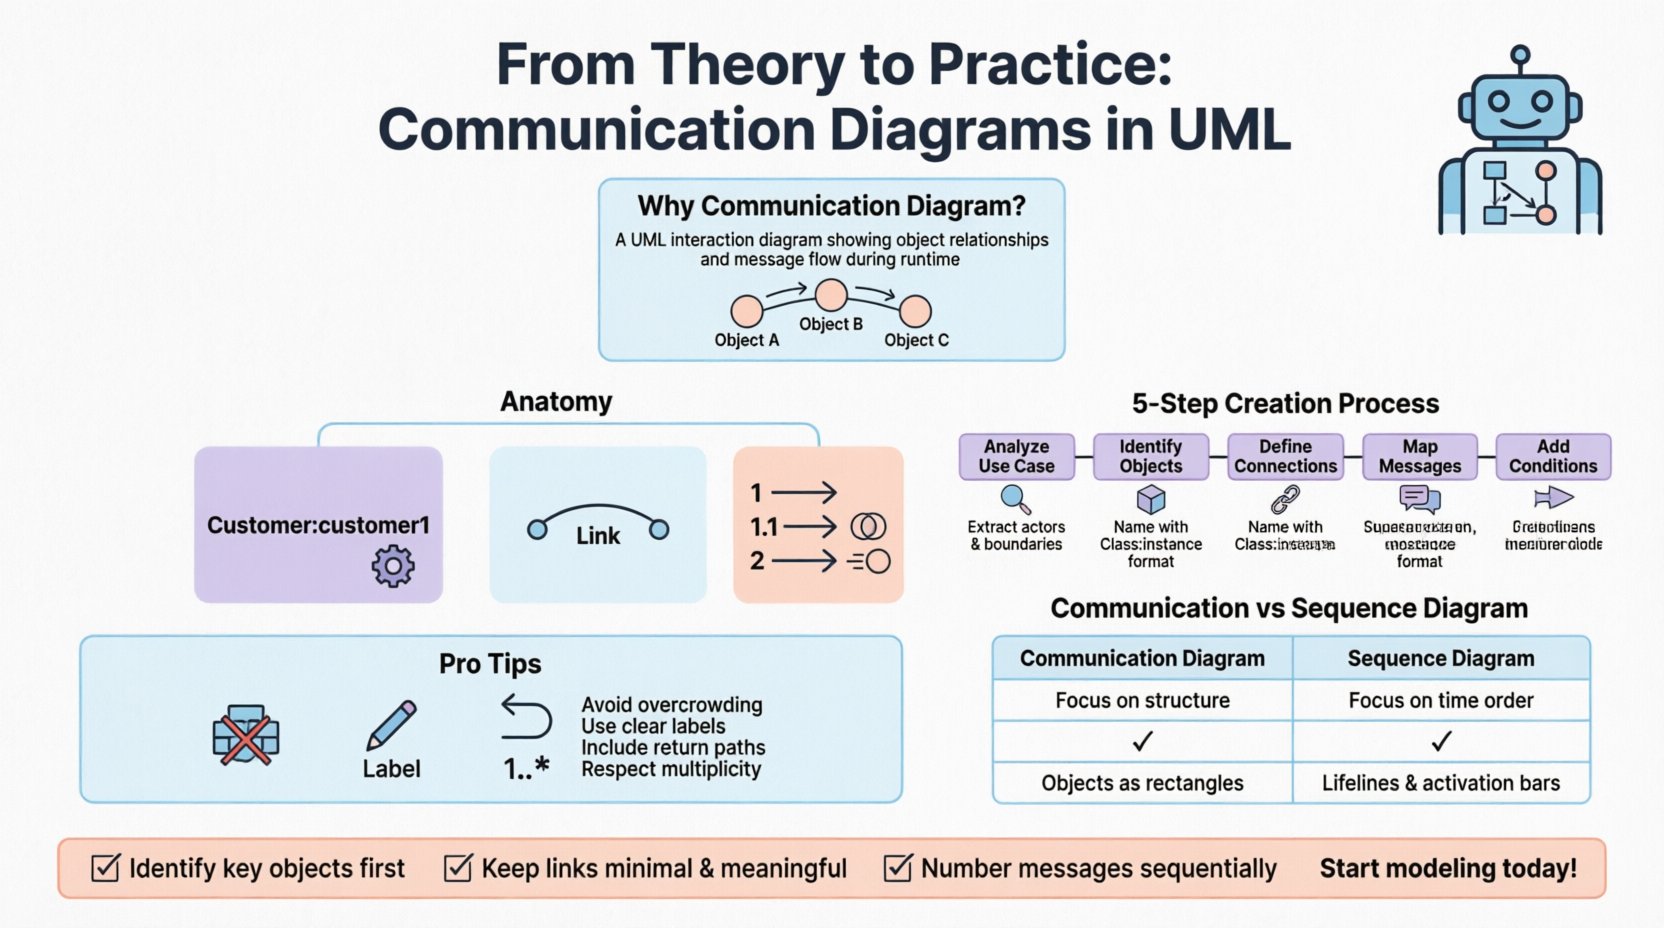
A Communication Diagram is a type of interaction diagram in UML. It focuses on the structural organization of objects and the messages they exchange. Unlike other diagrams that prioritize time, this format emphasizes the relationships between objects. It provides a snapshot of the system’s runtime behavior.
When building complex applications, developers and architects must visualize data flow. This diagram type helps identify which components initiate communication and which respond. It bridges the gap between static structure and dynamic process.
Focus: Object relationships and message flow.
Purpose: Clarify complex interactions.
Context: Part of UML 2.x standards.
Usage: Design phase and documentation.
By analyzing the connections between objects, teams can detect potential bottlenecks or circular dependencies early in the development lifecycle. This proactive approach reduces technical debt and improves system stability.
Anatomy of a Communication Diagram 🔍
To create an effective diagram, one must understand its constituent parts. Each element serves a specific function in conveying information about the system’s architecture.
1. Objects and Instances 📦
Objects represent specific instances of classes within the system. They are depicted as rectangles. The name usually includes the class name followed by a colon and an optional instance name (e.g., Customer:customer1).
Boundary Objects: Represent user interfaces or external systems.
Control Objects: Represent business logic or workflow management.
Entity Objects: Represent data storage or persistent information.
Placement on the diagram is not strictly defined by time, but by logical grouping. Objects that interact frequently should be positioned near one another to reduce visual clutter.
2. Links and Associations 🔗
Links represent the connections between objects. They show that one object knows about another. These lines are drawn between the object rectangles.
Direction: Can be bidirectional or unidirectional.
Multiplicity: Indicates how many instances can be connected (e.g., 1..*).
Role Names: Labels on the link describe the relationship from the perspective of each object.
Without clear links, the diagram loses its structural meaning. A message cannot travel without a defined path. Ensure every line represents a valid association in the class model.
3. Messages 💬
Messages are arrows drawn on top of the links. They represent the flow of control or data. Each message has a sequence number (1, 1.1, 1.2) to indicate order.
Synchronous: The sender waits for a response before proceeding.
Asynchronous: The sender continues immediately without waiting.
Return: Often shown as a dashed line or a second arrow.
Nesting messages is crucial for complex logic. If a message triggers another action, the nested message gets a decimal number (e.g., 2.1).
Step-by-Step Construction Guide 🛠️
Creating a diagram requires a methodical approach. Rushing leads to confusion. Follow these steps to ensure accuracy and clarity.
Step 1: Analyze the Use Case 📋
Start by defining the specific scenario you are modeling. Is it a user login? A payment processing flow? A data retrieval request?
Identify the primary actor or trigger.
Determine the expected outcome.
List the high-level requirements for the interaction.
Step 2: Identify Relevant Objects 🧩
Based on the use case, select the classes involved. Do not include every class in the system; focus only on those participating in this specific flow.
Look at the class diagram to find necessary classes.
Remove classes that are not directly involved in the message flow.
Ensure all necessary data holders are included.
Step 3: Define the Connections 🌐
Draw the links between the identified objects. This establishes the topology of the interaction.
Verify that the links match the associations in the class model.
Label the roles on the links if necessary for clarity.
Check multiplicity to ensure data constraints are respected.
Step 4: Map the Message Flow 🔄
Add the arrows representing the messages. Number them sequentially to show the order of execution.
Start with the first action initiated by the external actor.
Trace the path of data through the system.
Add return messages where appropriate to show completion.
Step 5: Add Conditions and Loops 🔄
Real-world logic is rarely linear. Use guards and loops to represent decision points.
Guards: Use square brackets [condition] to show when a message is sent.
Loops: Use
looporaltframes to denote repetition or alternatives.
Communication Diagram vs. Sequence Diagram 🆚
Both diagram types model interactions, but they serve different analytical purposes. Understanding the distinction helps in choosing the right tool for the job.
Feature | Communication Diagram | Sequence Diagram |
|---|---|---|
Focus | Structural organization and links | Time sequence and ordering |
Layout | Flexible spatial arrangement | Vertical timeline |
Complexity | Harder to read for long flows | Better for long, complex flows |
Readability | Shows object relationships clearly | Shows exact timing of events |
Use Case | Quick overview of interactions | Detailed behavioral analysis |
Use the Communication Diagram when you need to show how objects are connected in the context of a specific scenario. Use the Sequence Diagram when the timing of messages is critical to understanding the logic.
Advanced Notations and Features 🚀
Beyond the basics, advanced modeling techniques allow for greater precision in documentation.
Object States 🟢
Sometimes an object changes state during the interaction. You can denote this by adding the state to the object label (e.g., Order:pending). This adds context to why a specific message is sent.
Activation Bars 📊
While less common than in sequence diagrams, you can indicate when an object is actively processing. This helps visualize resource usage and processing time.
Combined Fragments 🧩
Complex interactions often involve optional steps or iterations. Use frames to group these sections.
Optional: [opt] – The interaction happens only if a condition is met.
Loop: [loop] – The interaction repeats.
Break: [break] – The flow exits early.
Practical Application Scenarios 🏗️
Applying these diagrams to real-world problems solidifies understanding. Here are common scenarios where this modeling technique shines.
Scenario 1: E-Commerce Checkout 🛒
Modeling a purchase process involves multiple systems. The Cart object interacts with the PaymentGateway and the InventoryManager.
Step 1: Customer requests checkout.
Step 2: Inventory reserves items.
Step 3: Payment is processed.
Step 4: Order confirmation is sent.
A Communication Diagram here highlights that the Inventory and Payment systems are distinct entities, preventing the assumption that they are part of the same module.
Scenario 2: API Integration 🔌
When integrating third-party services, the client application communicates with the API Gateway.
The Client sends a request.
The Gateway authenticates the user.
The Gateway routes the request to the Service.
The Service returns data.
This visualization helps developers understand the dependency chain and potential points of failure in the network.
Scenario 3: Microservices Architecture 🧱
In distributed systems, services communicate over a network. Diagrams help map out service dependencies.
Service A calls Service B.
Service B calls Service C.
Service C returns data to B, which returns to A.
This clarifies the call stack and helps in designing retry mechanisms or circuit breakers.
Common Errors and Optimization 🛑
Even experienced modelers make mistakes. Recognizing these pitfalls ensures high-quality documentation.
Overcrowding the Diagram 📉
A single diagram should not contain every interaction in the system. If it becomes too dense, split it into multiple diagrams based on functionality.
Group interactions by feature.
Create a high-level overview diagram.
Create detailed diagrams for complex sub-processes.
Ambiguous Labels 🗣️
Message names must be specific. Avoid generic terms like “Process” or “Check”.
Use GetUserData instead of Get.
Use ValidateInput instead of Check.
Use verbs that clearly describe the action.
Missing Return Paths 🔙
Ensure that every request has a corresponding return path, unless it is a fire-and-forget signal. Missing returns can imply a system hang.
Ignoring Multiplicity 🔢
Do not assume one-to-one relationships. If a user can have multiple orders, the link must reflect a one-to-many relationship. Ignoring this leads to incorrect assumptions about data capacity.
Maintenance and Version Control 📝
Diagrams are living documents. As the code evolves, the diagrams must follow.
Review Cycle: Update diagrams during sprint reviews.
Source Control: Store diagram files alongside code repositories.
Annotations: Add version numbers to the diagram header.
Change Logs: Document why changes were made to the interaction flow.
Stale diagrams can be more harmful than no diagrams. They create false expectations and mislead new team members. Treat them with the same rigor as code.
Final Thoughts on Dynamic Modeling 🏁
Effective communication in software engineering relies on clear visual aids. The Communication Diagram offers a unique perspective by prioritizing object relationships over strict timing. It complements other UML tools to provide a holistic view of system behavior.
By adhering to standard notations and following a structured creation process, teams can produce documentation that enhances collaboration. Focus on clarity, accuracy, and maintainability. These principles ensure that the diagrams remain valuable assets throughout the project lifecycle.
Start applying these concepts today. Identify a complex module in your current project and attempt to map its interactions. You may discover inefficiencies or clarify dependencies that were previously hidden. This practice strengthens architectural understanding and promotes better system design.
Key Takeaways ✅
Communication Diagrams focus on object links and message flow.
Use sequence numbers to indicate the order of messages.
Distinguish between synchronous and asynchronous calls.
Keep diagrams focused to avoid visual clutter.
Update diagrams regularly to match code changes.
Mastering this tool requires practice. Begin with simple scenarios and gradually increase complexity. As you refine your skills, these diagrams will become an essential part of your technical documentation toolkit.