
In the landscape of software architecture, clarity is currency. When designing complex systems, the choice of visualization tool determines how effectively a team understands the flow of logic and data. Two of the most prominent artifacts in the Unified Modeling Language (UML) are the Communication Diagram and the Sequence Diagram. Both depict interactions between objects, yet they serve different cognitive purposes. Selecting the right one is not merely a stylistic preference; it is a decision that impacts maintenance, onboarding, and the long-term health of the codebase. 🛠️
This guide provides a deep dive into the mechanics, applications, and trade-offs of both diagram types. We will move beyond surface-level definitions to explore how these tools function within the broader system design lifecycle. By the end, you will have a clear framework for deciding which diagram best suits your specific project requirements. 📐
Understanding the Sequence Diagram ⏳
The Sequence Diagram is often the default choice for many teams. It is a dynamic view that emphasizes the time-ordered flow of messages between objects. In this representation, time flows vertically from top to bottom. The horizontal axis represents different objects or participants, typically arranged as vertical lifelines. This structure makes it exceptionally good for answering the question: “What happens next?” 🔄
Here are the core components that define a Sequence Diagram:
- Lifelines: Vertical dashed lines representing the existence of an object or participant over time.
- Messages: Arrows connecting lifelines that indicate method calls, data passing, or signals.
- Activation Bars: Rectangular boxes on a lifeline showing when an object is actively performing an action.
- Combined Fragments: Boxes with labels like “alt” (alternative) or “loop” to denote conditional logic or repetition.
- Return Messages: Dashed arrows indicating a response from the target back to the sender.
The primary strength of the Sequence Diagram lies in its ability to model temporal dependencies. If your project relies heavily on strict ordering of operations, such as authentication protocols or transaction processing, this diagram type provides immediate clarity. It allows architects to spot potential race conditions or deadlocks by visualizing the exact sequence of events. 📅
Understanding the Communication Diagram 🕸️
The Communication Diagram, formerly known as the Collaboration Diagram, offers a different perspective. While it also models interactions, it prioritizes the structural relationships between objects over the chronological order. In this view, objects are placed as nodes in a network, and messages are numbered to indicate the sequence. This creates a map of connectivity rather than a timeline. 🗺️
Key characteristics of the Communication Diagram include:
- Object Placement: Objects are positioned based on their logical connections, often clustered by domain or function.
- Message Numbering: Each message carries a sequence number (1, 1.1, 1.2) to denote order without relying on vertical positioning.
- Links: Solid lines connecting objects represent associations or relationships, making the architecture visible.
- Focus on Structure: It highlights which objects talk to which other objects, emphasizing the topology of the interaction.
This diagram type is particularly useful when the system has a complex web of relationships. It answers the question: “Who is talking to whom?” rather than “When do they talk?” This distinction is vital for understanding the coupling and cohesion of a system. When you need to visualize the network of dependencies, the Communication Diagram shines. 🕸️
Key Differences at a Glance 📊
To fully grasp the divergence between these two artifacts, it is helpful to compare them directly. The following table outlines the structural and functional distinctions.
| Feature | Sequence Diagram | Communication Diagram |
|---|---|---|
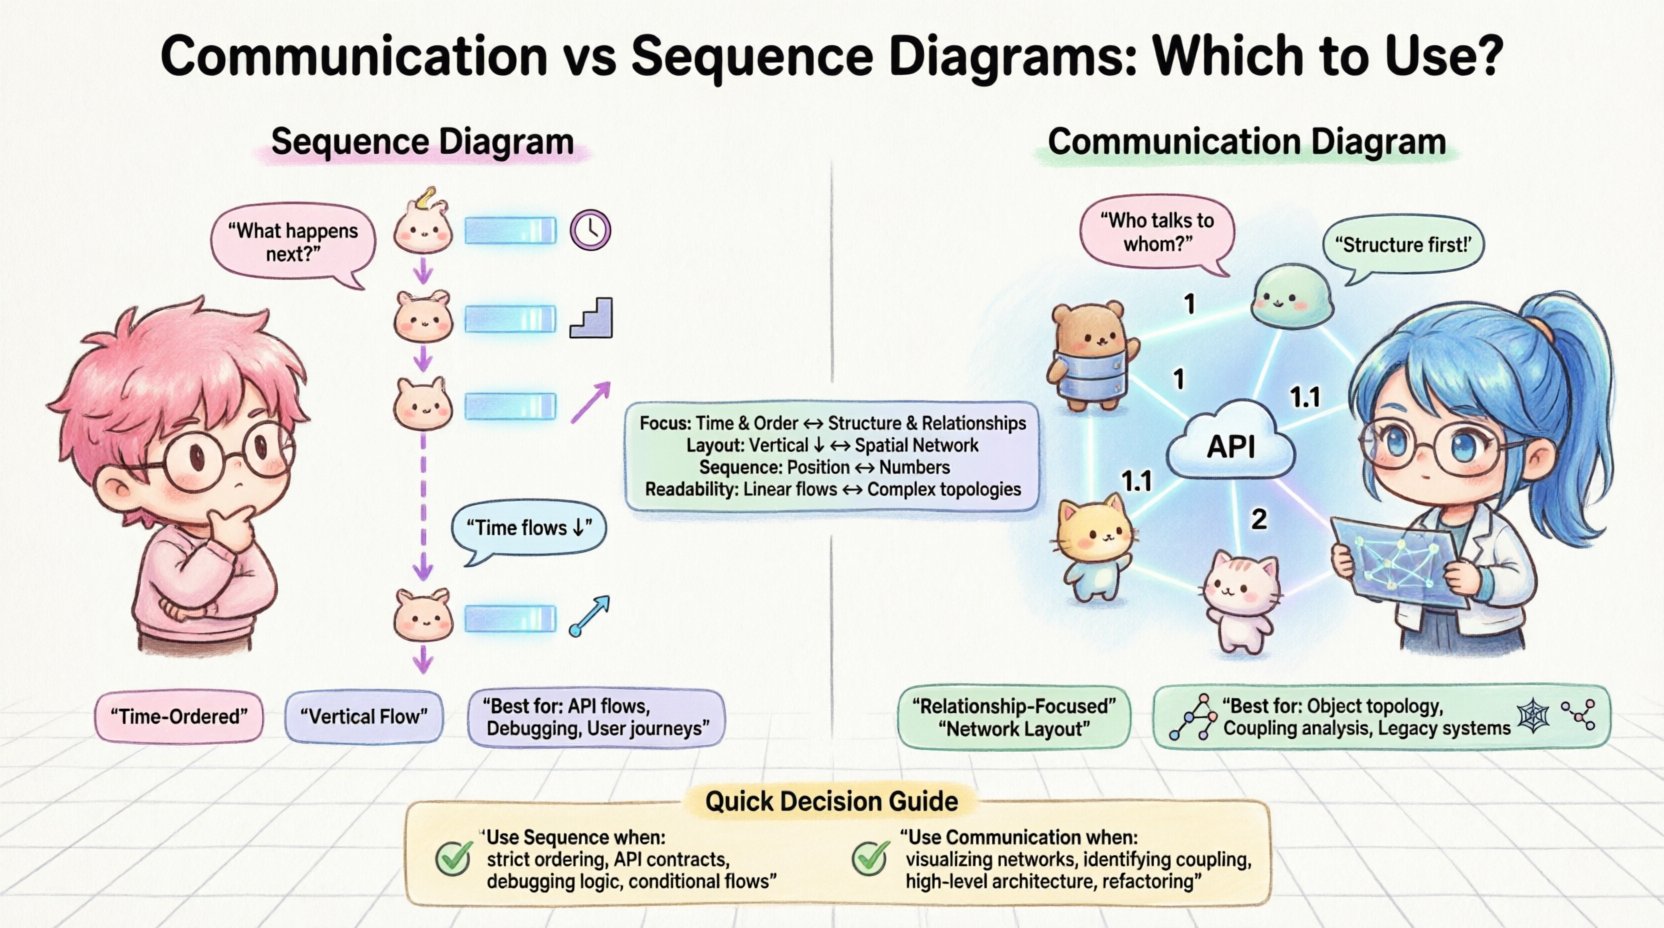
| Primary Focus | Time and Order | Structure and Relationships |
| Layout | Vertical flow (Top to Bottom) | Network layout (Spatial) |
| Sequence Indication | Vertical Position | Numerical Labels (1, 2, 3) |
| Readability | High for linear flows | High for complex topologies |
| Best For | API flows, State transitions | Object topology, Navigation paths |
| Complexity Handling | Can become crowded vertically | Can become cluttered spatially |
When to Use Sequence Diagrams 🧵
Choosing the Sequence Diagram is often the right path when the logic of the system is linear or time-sensitive. Consider this diagram type when:
- Defining API Contracts: When specifying how a client request translates into server-side actions, the step-by-step nature of the Sequence Diagram is ideal.
- Debugging Logic Errors: If a bug arises from the order of operations, visualizing the flow helps isolate the specific message that caused the failure.
- Documenting User Flows: For features where the user journey is paramount, showing the interaction from the user interface down to the database layer is effective.
- Complex Conditional Logic: Using “alt” and “opt” fragments, you can clearly map out decision points without losing the timeline context.
- Concurrency Analysis: You can use parallel fragments to show messages that happen simultaneously, which is harder to represent in a network view.
The Sequence Diagram excels in scenarios where the “when” is as important as the “what.” It reduces ambiguity regarding the lifecycle of an object within a specific interaction context. For developers implementing the code, this diagram acts as a strict script, reducing the chance of misinterpreting the intended execution order. 👩💻
When to Use Communication Diagrams 🌐
The Communication Diagram is the superior choice when the architecture itself is the primary concern. It is best utilized in the following scenarios:
- Visualizing Object Networks: When you need to show how services or modules are interconnected, the spatial arrangement reveals the topology.
- Identifying Coupling: By looking at the density of links between nodes, you can quickly spot areas of high coupling that might need refactoring.
- High-Level Architecture: For stakeholders who care more about the components involved than the exact millisecond of interaction, this diagram provides a cleaner overview.
- Refactoring Planning: If you are planning to restructure how objects relate to one another, this diagram helps you map the new relationships before coding begins.
- Navigating Legacy Systems: In complex legacy codebases, understanding which objects depend on which others is often more critical than the call order.
This diagram type supports a more holistic view of the system. It prevents the “tunnel vision” that can occur when focusing solely on a single linear path. By spreading the objects out, it encourages the team to think about the ecosystem of the interaction rather than just the transaction. 🏗️
Pros and Cons Analysis ⚖️
Every design artifact has limitations. Acknowledging these helps in managing expectations during the design phase.
Sequence Diagrams
- Pros: Excellent for showing detailed logic; easy to follow for linear processes; widely understood by most developers; ideal for testing scenarios.
- Cons: Can become very long if the interaction is deep; difficult to show complex object relationships; may not scale well for high-level architectural overviews.
Communication Diagrams
- Pros: Shows structural relationships clearly; compact for showing many objects; highlights dependencies; good for high-level collaboration views.
- Cons: Sequence is implicit (requires reading numbers); harder to visualize deep nesting or loops; spatial arrangement can be subjective and hard to automate.
Maintenance and Evolution 🔄
A critical, often overlooked aspect of diagramming is maintenance. As code evolves, diagrams can become obsolete if not kept in sync. The choice between Sequence and Communication diagrams impacts this effort.
Sequence Diagram Maintenance: Because these diagrams focus on specific paths, they often need to be recreated for different scenarios. If you have ten different ways a user can check out, you might need ten different Sequence Diagrams. This can lead to documentation bloat. However, they are generally easier to update if the code changes because the flow is usually explicit in the code.
Communication Diagram Maintenance: These diagrams often represent the static structure of the interaction. If the relationships between objects change, the diagram needs to be redrawn. However, a single Communication Diagram can often cover multiple scenarios because the structure remains constant even if the message sequence changes slightly. This makes them more stable over time for architectural documentation.
Best Practices for Effective Diagramming 📝
Regardless of which tool you choose, adhering to certain principles ensures the diagrams remain valuable assets.
- Keep It Simple: Avoid showing every single getter and setter. Focus on the business logic and critical data flows. Simplicity aids understanding.
- Consistent Naming: Use clear, domain-specific names for objects. Avoid generic terms like “Object1” or “Handler” unless necessary.
- Limit Scope: Do not attempt to model the entire system in one diagram. Break complex interactions into smaller, focused scenarios.
- Use Standard Notation: Adhere to UML standards so that other engineers can read the diagrams without a learning curve.
- Automate Where Possible: If your environment supports it, generate diagrams from code. This ensures the documentation always matches the implementation.
- Review with the Team: A diagram is useless if the team does not understand it. Walk through the artifact during design reviews to validate the logic.
Real-World Application Scenarios 🏭
To illustrate the decision-making process, consider these practical examples.
Scenario 1: Microservices Integration
You are building a system where a frontend application calls a payment service, which then calls a notification service.
Recommendation: Use a Sequence Diagram. The order of calls is critical here. If the notification fails, the payment transaction must handle the rollback. The timing and dependency chain are the primary concerns.
Scenario 2: Domain-Driven Design (DDD) Modeling
You are defining the boundaries between aggregates in a complex banking application. You need to show how a “Account” object interacts with a “Transaction” object and a “Ledger” object.
Recommendation: Use a Communication Diagram. The structural relationship and the shared responsibility of these objects are more important than the specific order of method calls. You want to see the network of trust and dependency.
Scenario 3: API Gateway Routing
You are designing the logic for an API Gateway that routes requests to different backend services based on headers.
Recommendation: Use a Sequence Diagram. The conditional logic (routing) is best expressed with “alt” fragments, showing the decision tree clearly.
Scenario 4: Legacy Code Refactoring
You are analyzing a monolithic application to identify which modules can be extracted into microservices.
Recommendation: Use a Communication Diagram. You need to see the high-level coupling between modules. A network view reveals which services are tightly bound and should be moved together.
Frequently Asked Questions ❓
- Can I use both diagrams for the same feature?
Yes. It is common to use a Communication Diagram to define the architecture and a Sequence Diagram to define the specific logic for a critical transaction. - Which one is better for documentation?
It depends on the audience. For developers debugging code, Sequence is better. For architects reviewing system health, Communication is better. - Can I convert a Sequence Diagram to a Communication Diagram?
Yes, the information is largely equivalent, but the visual layout changes. You must renumber the messages and reposition the objects. - Are these diagrams part of the codebase?
They should be treated as living documents. If they are not updated alongside code changes, they become misleading and should be removed. - Do I need to draw these for every function?
No. Focus on complex, critical, or high-risk areas. Simple CRUD operations often do not require detailed interaction diagrams.
Final Thoughts on Selection 🎯
The decision between a Communication Diagram and a Sequence Diagram is not about which is superior, but which is appropriate for the context. Both tools are part of the same ecosystem and share the same underlying data. The value comes from how you leverage them to reduce cognitive load.
If your goal is to understand the flow of control, choose the Sequence Diagram. If your goal is to understand the structure of the system, choose the Communication Diagram. Often, the most effective approach involves using both, each for its specific strength. By applying these distinctions thoughtfully, you ensure that your system design remains clear, maintainable, and aligned with the team’s understanding. 🚀