
Understanding how different parts of a software system interact is a fundamental skill for any technical professional. One of the most effective ways to visualize this temporal flow is through a sequence diagram. These diagrams provide a clear map of interactions between objects or processes over time. Whether you are designing a new feature, debugging a complex flow, or documenting an existing system, knowing the specific components is essential.
This guide breaks down every element you will encounter in a standard UML sequence diagram. We will explore lifelines, messages, activation bars, and control structures without relying on specific tools. By the end of this article, you will be able to read and construct these diagrams with confidence and clarity.
Why Sequence Diagrams Matter 🧭
Before diving into the anatomy, it is helpful to understand the purpose. A sequence diagram is a type of interaction diagram. It focuses on the order of events rather than the structure of the objects involved. This makes it ideal for:
- Visualizing Logic: Seeing the step-by-step execution of a function or API call.
- Identifying Bottlenecks: Spotting where a process waits or loops excessively.
- Communication: Bridging the gap between developers, designers, and stakeholders.
- Documentation: Creating a reference that explains how the system behaves under specific conditions.
Unlike a class diagram, which shows static structure, the sequence diagram shows dynamic behavior. It places time on the vertical axis and space (or participants) on the horizontal axis. This coordinate system allows you to trace the flow from top to bottom.
Core Components of a Sequence Diagram 🧩
A sequence diagram is built from a few fundamental building blocks. Mastering these basics allows you to construct complex interactions later. Below is a detailed look at the primary elements.
1. Participants and Lifelines 👥
Participants represent the entities involved in the interaction. These can be human users, external systems, internal services, or database layers. In the diagram, they are represented at the top. From each participant, a vertical line extends downwards.
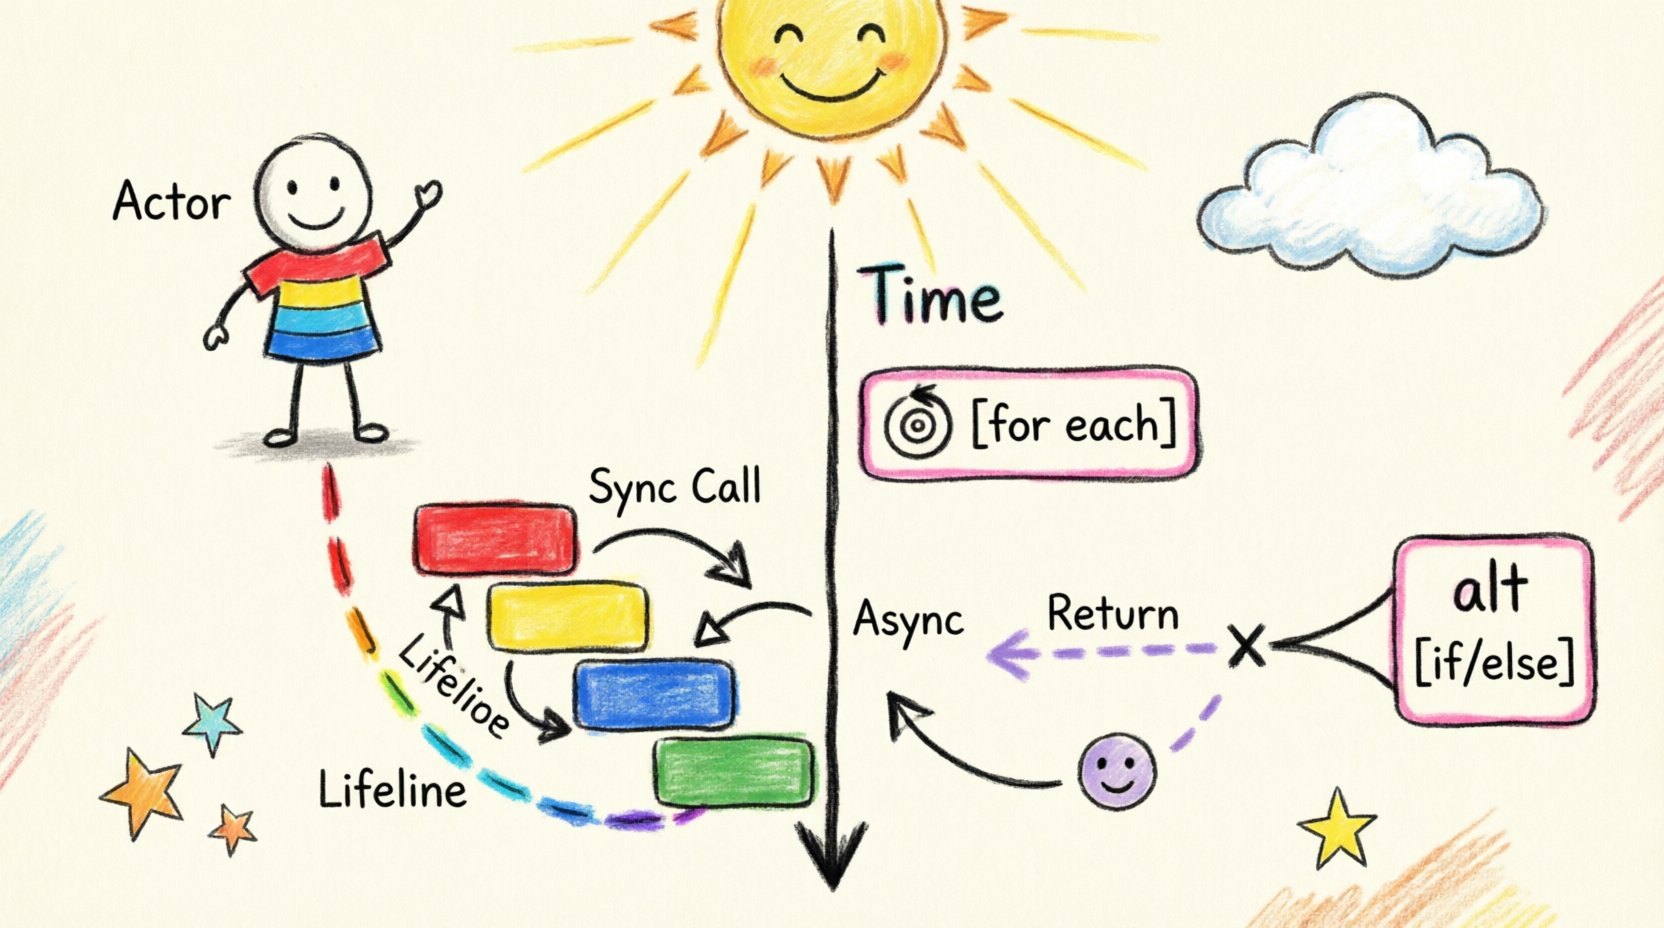
- Actor: Usually depicted as a stick figure icon. This represents a human user or an external system initiating the process.
- Object: Represented by a rectangle. This is an internal component within the system being modeled.
- Lifeline: The vertical dashed line extending from the participant. It represents the existence of that participant over time.
Every interaction happens along a lifeline. If a message is sent to an object, it must arrive at the top of its lifeline. If a message is returned, it originates from the lifeline. The position of the lifeline establishes the spatial relationship between participants.
2. Messages 💬
Messages are the arrows connecting the lifelines. They represent the transfer of information or control between participants. The direction and style of the arrow indicate the type of communication.
- Synchronous Call: A solid line with a filled arrowhead. The sender waits for the receiver to finish the task before continuing. This is the most common interaction type.
- Asynchronous Call: A solid line with an open arrowhead. The sender sends the message and continues its own work without waiting.
- Return Message: A dashed line with an open arrowhead pointing back to the sender. This indicates data or a response being sent back.
- Self-Message: An arrow that starts and ends on the same lifeline. This represents a method calling another method within the same object.
Labeling is crucial. Every message should have a clear name describing the action, such as getUserData() or sendConfirmation(). If a message carries data, you can list parameters inside parentheses.
3. Activation Bars (Execution Occurrences) ⏳
When a participant is actively processing a message, its lifeline is highlighted with a narrow rectangle. This is called an activation bar.
- Duration: The vertical length of the bar represents how long the participant is busy.
- Overlap: If multiple bars overlap, it often implies a nested process or a chain of dependencies.
- Focus: It helps the viewer see exactly when a specific component is working versus when it is idle.
Without activation bars, a diagram can look cluttered. However, in simple sketches, they are sometimes omitted for brevity. For detailed technical specifications, they are highly recommended.
4. Combined Fragments 📑
p>Complex logic rarely follows a single straight line. Combined fragments allow you to group messages and define control flow. These are often enclosed in a large box with a label in the top-left corner.- Loop: Indicates that a set of messages repeats. Often used for database queries iterating through a list or retries.
- Alt (Alternative): Represents conditional logic (if/else). It splits the flow into different paths based on a condition.
- Opt (Optional): Similar to Alt, but indicates a message that may or may not happen.
- Par (Parallel): Shows that two or more lifelines are performing actions simultaneously.
- Ref (Reference): Points to another sequence diagram. This is useful for breaking down large systems into manageable chunks.
Visual Syntax and Symbols 🎨
To ensure clarity, standard notation is used across the industry. Deviating from these standards can confuse readers. Below is a reference table for the most common symbols.
| Symbol | Meaning | Usage Context |
|---|---|---|
| ↦ (Solid Arrow) | Synchronous Call | Standard function call where the caller waits. |
| ↪ (Open Arrow) | Asynchronous Call | Fire-and-forget messages or background tasks. |
| ⇢ (Dashed Arrow) | Return | Data response or completion signal. |
| ⏺️ (Rect on Line) | Activation | Indicates active processing time. |
| ⚠️ (Note Box) | Comment | Additional context or explanation. |
| 🔒 (Frame Box) | Combined Fragment | Loops, conditions, or parallel processes. |
Detailed Breakdown of Control Structures 🔄
Once you understand the static elements, you need to understand how to manage flow. Real-world systems branch, loop, and parallelize. Here is how to model those behaviors effectively.
Handling Loops (Loop)
Loops are essential for processing collections of data. In a sequence diagram, a loop fragment surrounds the messages that repeat.
- Condition: You should specify the iteration condition, such as [for each item] or [while user is logged in].
- Optimization: If a loop is very large, you might use a Ref to point to a separate diagram detailing the loop logic.
- Clarity: Avoid nesting loops too deeply. If you have a loop inside a loop, consider simplifying the logic or splitting the diagram.
Conditional Logic (Alt)
Every decision point needs a clear path. The Alt fragment divides the diagram into frames. Each frame has a guard condition in brackets.
- True/False: The most common use case. One path for success, one for failure.
- Multiple Options: You can have multiple frames for different states (e.g., [user is admin], [user is guest]).
- Default: One frame can be left empty to represent the default case when no other condition matches.
Parallel Processes (Par)
Systems often perform tasks simultaneously to improve performance. The Par fragment shows that different lifelines are active at the same time.
- Independence: Actions in parallel frames usually do not depend on each other.
- Concurrency: This is useful for showing background processing, such as sending an email while saving a file.
- Timing: Note that the vertical position still implies time, even if the action is parallel.
Annotations and Notes 📝
p>Not every piece of information fits into a message or a lifeline. Sometimes you need to add context, warnings, or external references. This is where notes come in.- Attached Note: A rectangle with a folded corner attached to a specific element. It explains why a specific step exists.
- General Note: A note that floats near a participant or fragment without a direct line. This is used for global constraints or assumptions.
- Link to Artifact: If a specific requirement or database schema is relevant, you can reference it in a note.
Use notes sparingly. Too many annotations can clutter the diagram and distract from the primary flow. They should add value, not just fill space.
Best Practices for Designing Diagrams 🛠️
Creating a sequence diagram is an art form. It requires balancing detail with readability. Follow these guidelines to ensure your diagrams are effective.
1. Define the Scope
Do not try to diagram the entire system in one view. A sequence diagram should focus on a single use case or a specific scenario. If a diagram becomes too wide or too tall, break it into multiple diagrams.
- Single Thread: Focus on one happy path first. Add error handling paths later.
- Boundary: Clearly define where the system starts and ends. Don’t include external infrastructure unless it is critical to the interaction.
2. Keep It Abstract
Avoid getting bogged down in implementation details like variable names or specific SQL queries. Focus on the what and why, not the how.
- High Level: Use terms like validateUser instead of checkPasswordHash().
- Consistency: Ensure participant names match across different diagrams in the same project.
3. Readability is King
Arrange your participants logically. Place the initiator on the far left and the database or external service on the far right. This creates a natural left-to-right reading flow.
- Spacing: Ensure there is enough horizontal space between lifelines to prevent message arrows from crossing awkwardly.
- Alignment: Align messages where possible. If a message from A to B and B to C happens in sequence, try to keep them vertically aligned.
4. Naming Conventions
Consistent naming prevents confusion. Use a standard format for your messages and participants.
- Verbs: Start messages with verbs (e.g., Fetch, Create, Update).
- Nouns: Name participants based on their role (e.g., PaymentGateway, OrderService).
- Case: Stick to CamelCase or PascalCase for consistency.
Common Pitfalls to Avoid 🚫
Even experienced designers make mistakes. Being aware of common traps will save you time during reviews and maintenance.
- Spaghetti Arrows: If message arrows cross each other excessively, it indicates poor participant ordering. Reorder the lifelines.
- Missing Returns: If a message is sent, usually a return is expected. If not, clarify that it is an asynchronous fire-and-forget call.
- Overusing Fragments: Don’t put every single step inside a loop or alt frame. Only use them when the logic actually requires branching or repetition.
- Ignoring Time: Remember that the vertical axis is time. If you draw two messages at the same vertical level, they are happening simultaneously.
Reading vs. Creating 📖
There is a slight difference between reading an existing diagram and creating a new one. When reading, you are decoding information. When creating, you are encoding logic.
Reading Strategy
- Top-Down: Always start at the top. Time flows downwards.
- Trace the Path: Follow the solid arrows to understand the main flow.
- Check the Frames: Look for loop or alt frames to understand the logic conditions.
- Identify the Actors: Know who is involved before you dive into the messages.
Creating Strategy
- Write the Steps: List the steps in text format first. This helps you organize the logic before drawing.
- Sketch Roughly: Use a whiteboard or pen to map out the layout.
- Refine: Move to the final tool only when the logic is solid.
- Review: Walk through the diagram as if you were a system executing it. Does it make sense?
Advanced Patterns for Complex Systems 🔗
As systems grow, simple diagrams may not suffice. Here are some advanced patterns to handle complexity.
Message Queues
Modern architectures often use queues. Instead of a direct arrow, you might show a message going into a queue symbol, which is then picked up by a worker later. This indicates a decoupled system.
Timeouts and Errors
Explicitly show what happens when a service is slow or fails. Use dashed lines for error returns or a specific Alt frame for exception handling. This ensures the diagram reflects reality, not just the happy path.
State Changes
While sequence diagrams focus on interaction, sometimes you need to show state changes. You can add notes indicating the state of an object before and after a message.
Final Thoughts on Interaction Modeling 🌟
Sequence diagrams are more than just pictures; they are a language. They allow technical teams to speak the same dialect regarding system behavior. By understanding the components—lifelines, messages, activations, and fragments—you gain the ability to document, debug, and design with precision.
Remember that diagrams are living documents. They should evolve as the system changes. Keeping them up to date ensures that new team members can onboard quickly and that legacy logic remains understandable. Focus on clarity, consistency, and accuracy, and your diagrams will become invaluable assets for your projects.
Start practicing by drawing simple flows. Gradually introduce loops and conditionals. With time, you will find that visualizing the temporal logic of your systems becomes second nature. This skill is a cornerstone of effective software architecture and system design.