
Software architecture relies heavily on visual representations to convey complex interactions between system components. Among the various types of diagrams available, the Communication Diagram stands out as a powerful tool for understanding object interactions. Unlike flowcharts that focus on process steps, this diagram type emphasizes the relationships and messages exchanged between objects. For a software engineer, the ability to interpret these visuals quickly translates to better debugging, cleaner design, and more effective collaboration with team members. 🧠
What is a Communication Diagram? 📋
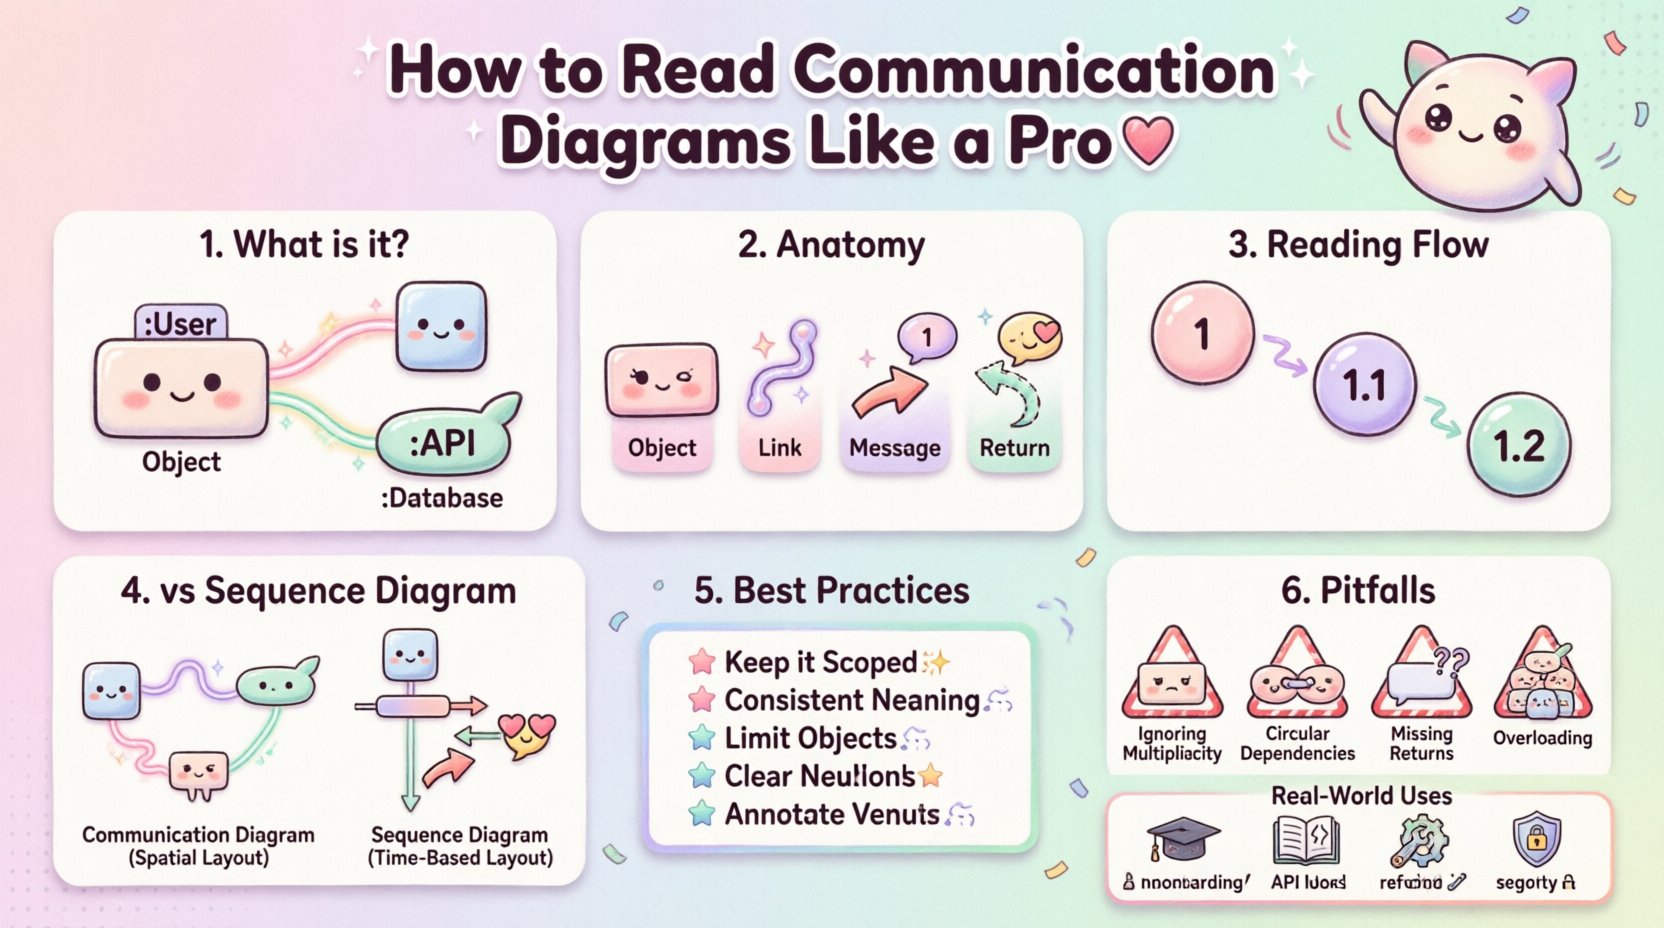
A Communication Diagram is a type of Unified Modeling Language (UML) diagram. It illustrates how different objects or system components interact to achieve a specific goal. In the past, these were often referred to as Collaboration Diagrams, but the terminology has evolved. The core purpose is to show the structural organization of objects and the messages sent between them.
When you look at a Communication Diagram, you are essentially looking at a snapshot of a dynamic interaction. You see the static structure (the objects) overlaid with dynamic behavior (the messages). This dual nature makes it distinct from Sequence Diagrams, which prioritize time, while Communication Diagrams prioritize spatial relationships. 🔄
- Focus: Object relationships and message flow.
- Context: Part of the UML behavioral diagrams.
- Use Case: Designing complex system interactions and documenting API contracts.
Anatomy of the Diagram 🔍
To read these diagrams like a professional, you must understand the fundamental building blocks. Every element serves a specific purpose in defining the system’s behavior. Missing one detail can lead to significant misunderstandings during implementation.
1. Objects and Instances 📦
Objects represent entities within the system. They are typically drawn as rectangles with an underline. The name of the object usually indicates the class it belongs to, followed by a colon and the instance name. For example, OrderProcessor:processor1 tells you this is a specific instance of the OrderProcessor class.
- Class Name: The part before the colon.
- Instance Name: The part after the colon (optional in some notations).
- Multiplicity: Sometimes indicated near the object to show how many instances exist.
2. Links and Associations 🔗
Links are the lines connecting objects. They represent the structural relationships, such as associations or dependencies. In a Communication Diagram, these links are crucial because messages travel along them. If there is no link between two objects, messages generally cannot pass between them directly.
3. Messages 💬
Messages are arrows indicating communication. They carry the actual logic or data transfer instructions. Each message has a label, which describes the operation being invoked. The arrow direction shows who is calling whom.
- Arrow Head: Indicates the direction of the call.
- Label: The name of the method or operation.
- Sequence Number: A number (1, 2, 3…) indicates the order of execution.
4. Return Messages ↩️
Not all interactions are one-way. When a method returns a value, a return message is often shown. This is typically a dashed line with an arrow pointing back to the caller. It confirms that the operation has completed.
Reading Order and Flow 📈
Unlike a Sequence Diagram where time flows vertically from top to bottom, Communication Diagrams do not have a strict vertical timeline. Instead, the flow is determined by sequence numbers attached to the messages. This requires a different reading strategy.
- Locate the Start: Find the object that initiates the interaction. This is often the external actor or the entry point of the system.
- Follow the Numbers: Look for the sequence number
1. Trace the message from the initiator to the receiver. - Trace Nested Calls: If the receiver sends a new message, it will have a higher number (e.g.,
1.1or2). Follow these nested interactions until they resolve. - Check Returns: Ensure every request has a corresponding return path, especially for critical data operations.
Example Scenario:
1. User initiates logingoes toAuthController.1.1 AuthController calls UserService.1.2 UserService calls DatabaseRepository.1.2.1 DatabaseRepository fetches data.1.2.2 DatabaseRepository returns datatoUserServiceImpl.1.3 UserServiceImpl validates data.1.4 UserServiceImpl returns tokentoAuthController.1.5 AuthController returns responsetoUser.
Communication vs. Sequence Diagrams 🆚
Choosing between diagram types depends on what you need to convey. Both are valid UML behavioral diagrams, but they serve different analytical purposes. Understanding the differences helps you select the right tool for the job. 🛠️
| Feature | Communication Diagram | Sequence Diagram |
|---|---|---|
| Primary Focus | Structural relationships between objects | Temporal sequence of events |
| Layout | Flexible, spatial arrangement | Vertical, time-based columns |
| Readability | Good for complex object networks | Good for linear flows |
| Message Count | Can show many objects on one page | Can become very tall with many steps |
| Complexity | Can get messy with many cross-links | Clearer for long chains of events |
Best Practices for Design 🎯
Creating clear diagrams is just as important as reading them. Poor design leads to confusion. Follow these guidelines to ensure your diagrams remain useful documentation artifacts.
- Keep it Scoped: Do not try to document the entire system in one diagram. Break it down by feature or module. A single diagram should focus on one specific use case.
- Use Consistent Naming: Ensure object names match the codebase. If the code uses
UserManager, the diagram should useUserManager, notUserController. - Limit Object Count: If a diagram has more than 15 objects, it is likely too complex. Split it into smaller, focused views.
- Number Messages Clearly: Use hierarchical numbering (1, 1.1, 1.1.1) to show nesting depth. This helps in understanding recursion and loops.
- Annotate Conditions: Use notes to explain guard conditions. For example, if a message only occurs if a status is
active, write that condition near the arrow.
Common Pitfalls ⚠️
Even experienced engineers make mistakes when interpreting or creating these diagrams. Being aware of common errors can save you time during code reviews.
1. Ignoring Multiplicity
Objects often represent collections. A Cart object might hold multiple Item objects. If the diagram does not specify that a message is sent to all items or just one, ambiguity arises. Always clarify if a loop is involved.
2. Missing Return Paths
It is easy to draw the outgoing call and forget the response. While some tools omit return messages for brevity, in complex logic, the return value is critical. A missing return might imply a void method when one actually returns a status code.
3. Circular Dependencies
If Object A calls Object B, and Object B calls Object A without a clear termination condition, you have a potential deadlock. Mark these recursive calls clearly with a loop symbol or an asterisk.
4. Overloading the Diagram
Trying to show every single message makes the diagram unreadable. Group related actions or omit low-level technical calls (like database connection details) unless they are critical to the logic.
Advanced Notations 🧩
Standard diagrams cover most scenarios, but edge cases require specific notations. Understanding these symbols allows you to document complex logic accurately.
Loops and Iteration 🔄
When an object iterates over a collection, you might see a loop notation. This is often a small arrow looping back to the same message or a frame labeled loop. It indicates that the message is sent multiple times. For example, processing every item in an order list.
Optional Fragments 📌
Not all paths are taken every time. Use opt (optional) frames to show conditional logic. This is useful when a feature is enabled only under specific configuration settings.
Alternative Paths 🛤️
When there are multiple possible outcomes, use alt (alternative) frames. This shows that if condition A is met, Message X happens. If condition B is met, Message Y happens. This is vital for error handling flows.
Recursive Calls 🔄
Some algorithms call themselves. Represent this by having an arrow point from the object back to itself. Add a note explaining the base case to prevent infinite loops.
Application in Real-World Scenarios 🌍
Why does this matter in daily work? These diagrams are not just academic exercises. They serve practical purposes in the software development lifecycle.
- Onboarding New Developers: A well-drawn diagram helps new hires understand how services talk to each other without reading thousands of lines of code.
- API Documentation: Frontend teams need to know what backend services they can call. A communication diagram provides a visual contract.
- Refactoring: Before changing a class, map out its dependencies. If you remove a method, the diagram shows who will break.
- Security Audits: Reviewing message flows helps identify unauthorized data paths or potential injection points between services.
Maintenance and Updates 🔄
A diagram that is not updated is worse than no diagram at all. Code changes frequently, and static diagrams become obsolete quickly. Here is how to keep them relevant.
- Code as Source of Truth: Treat the diagram as documentation, not the definition. If the code changes, the diagram should be updated in the same commit or pull request.
- Automated Generation: Where possible, use tools that can extract diagrams from code annotations. This reduces the manual effort and keeps them in sync.
- Version Control: Store diagrams alongside the code they represent. This makes it easy to track when a specific architectural decision was made.
- Review Process: Include diagrams in code review checklists. If a PR changes interaction logic, the diagram must be reviewed too.
Final Thoughts on System Visualization 🌟
Mastering the ability to read and create Communication Diagrams adds a layer of clarity to your engineering work. It forces you to think about the system in terms of interactions rather than just isolated functions. This shift in perspective is valuable when designing scalable, maintainable software.
Start small. Pick a module you are familiar with and try to sketch its interactions. You will likely spot gaps in your understanding or potential bottlenecks in the design. Over time, this practice becomes second nature, allowing you to visualize complex flows mentally before writing a single line of code. 🚀
Remember, the goal is clarity. Whether you are explaining a flow to a stakeholder or debugging a race condition, a clear diagram bridges the gap between abstract logic and concrete implementation. Keep your diagrams simple, accurate, and up-to-date to maximize their value to your team.