
Creating a clear visual representation of system functionality is essential for software development. A UML Use Case Diagram provides a high-level view of how users interact with a system. This guide outlines a streamlined approach to drafting these diagrams without getting bogged down in unnecessary complexity. Whether you are a business analyst, a developer, or a stakeholder, understanding the interactions between actors and the system is crucial for defining requirements.
By following this structured method, you can produce a functional diagram in a short timeframe. The focus here is on clarity, accuracy, and communication. We will avoid tool-specific instructions to keep the methodology universal. Instead, we will focus on the core concepts that apply regardless of the medium used for drawing.
📋 Understanding the Use Case Diagram
A Use Case Diagram is a behavioral diagram in the Unified Modeling Language (UML) family. It captures the dynamic aspects of a system by showing who uses what functionality. It does not detail *how* the system works internally, but rather *what* it does for the user. This distinction is vital for keeping the scope manageable during the design phase.
Key Components
Before starting, familiarize yourself with the fundamental building blocks:
- Actors: Representations of users or external systems that interact with the software. They are depicted as stick figures.
- Use Cases: Specific functions or services provided by the system. These are shown as ovals.
- System Boundary: A rectangle that defines the scope of the system being modeled. Everything inside belongs to the system; everything outside is external.
- Associations: Lines connecting actors to use cases, indicating a relationship.
- Relationships: Lines connecting use cases to other use cases (e.g., Include, Extend, Generalization).
🛠️ Prerequisites for the 10-Minute Method
To begin this process efficiently, you do not need specialized software. You need a clear understanding of the system’s purpose. Gather the following information before you start drawing:
- System Goals: What is the primary purpose of this system?
- Target Audience: Who will be using it?
- Core Functions: What are the main tasks the system must perform?
Having these details ready prevents scope creep and keeps the diagram focused. If you are working in a team, ensure you have a brief discussion with stakeholders to validate these points. This preparation phase is part of the 10 minutes, even if it happens mentally before the drawing begins.
📝 Step-by-Step: Drafting the Diagram
Follow this sequence to build your diagram logically. Each step builds upon the previous one.
Step 1: Define the System Boundary
Start by drawing a large rectangle. Label this box with the name of the system. This rectangle acts as a container. Any use case inside this box is part of the system’s responsibility. Anything outside is handled by the environment or external entities.
- Draw a clean rectangle.
- Place the system name clearly in the top-left corner of the rectangle.
- Ensure the boundary is large enough to accommodate potential use cases without crowding.
Step 2: Identify the Actors
Look at your list of target users and external systems. Draw stick figures outside the system boundary. Place actors where they naturally connect to the system.
- Primary Actors: Those who initiate the system to achieve a goal (e.g., Customer, Admin).
- Secondary Actors: Those that assist the system (e.g., Payment Gateway, Email Server).
- System Actor: Occasionally, a system might trigger another system.
Label each stick figure clearly. Avoid vague labels like “User.” Instead, use specific roles like “Registered Customer” or “Guest User.” Specificity reduces ambiguity later.
Step 3: Define the Use Cases
Inside the system boundary, draw ovals. Each oval represents a distinct function or service. These should be noun phrases describing the goal of the action, not verbs describing the process.
- Write “Place Order” instead of “Ordering”.
- Write “View Report” instead of “Generating a Report”.
- Keep the text concise. If a use case is too long, it might be a sign it should be split.
Step 4: Draw Associations
Connect the actors to the relevant use cases using solid lines. This line indicates that the actor interacts with the use case. An actor can connect to multiple use cases, and a use case can have multiple actors.
- Draw a straight line from the actor to the use case oval.
- Do not cross lines unnecessarily to maintain readability.
- If an actor is on the left, place the use cases in the center, and other actors on the right.
Step 5: Add Relationships (Optional for Basic)
For a basic diagram, associations are often sufficient. However, if functions depend on each other, add relationship lines between use cases.
- Include: One use case always includes the behavior of another (e.g., “Login” always includes “Enter Password”).
- Extend: One use case adds optional behavior to another (e.g., “Apply Discount” extends “Place Order”).
- Generalization: Inheritance between actors or use cases (e.g., “VIP Customer” is a type of “Customer”).
🔍 Detailed Look at Relationships
Understanding the differences between relationship types is critical for accurate modeling. Below is a structured comparison to guide your decisions.
| Relationship Type | Symbol | Meaning | Example |
|---|---|---|---|
| Association | Solid Line | Actor interacts with Use Case | Customer places order |
| Include | Dashed Line + <<include>> | Mandatory dependency | Login includes Verify Credentials |
| Extend | Dashed Line + <<extend>> | Optional dependency | Place Order extends Apply Promo Code |
| Generalization | Solid Line + Triangle | Inheritance | VIP Customer is a Customer |
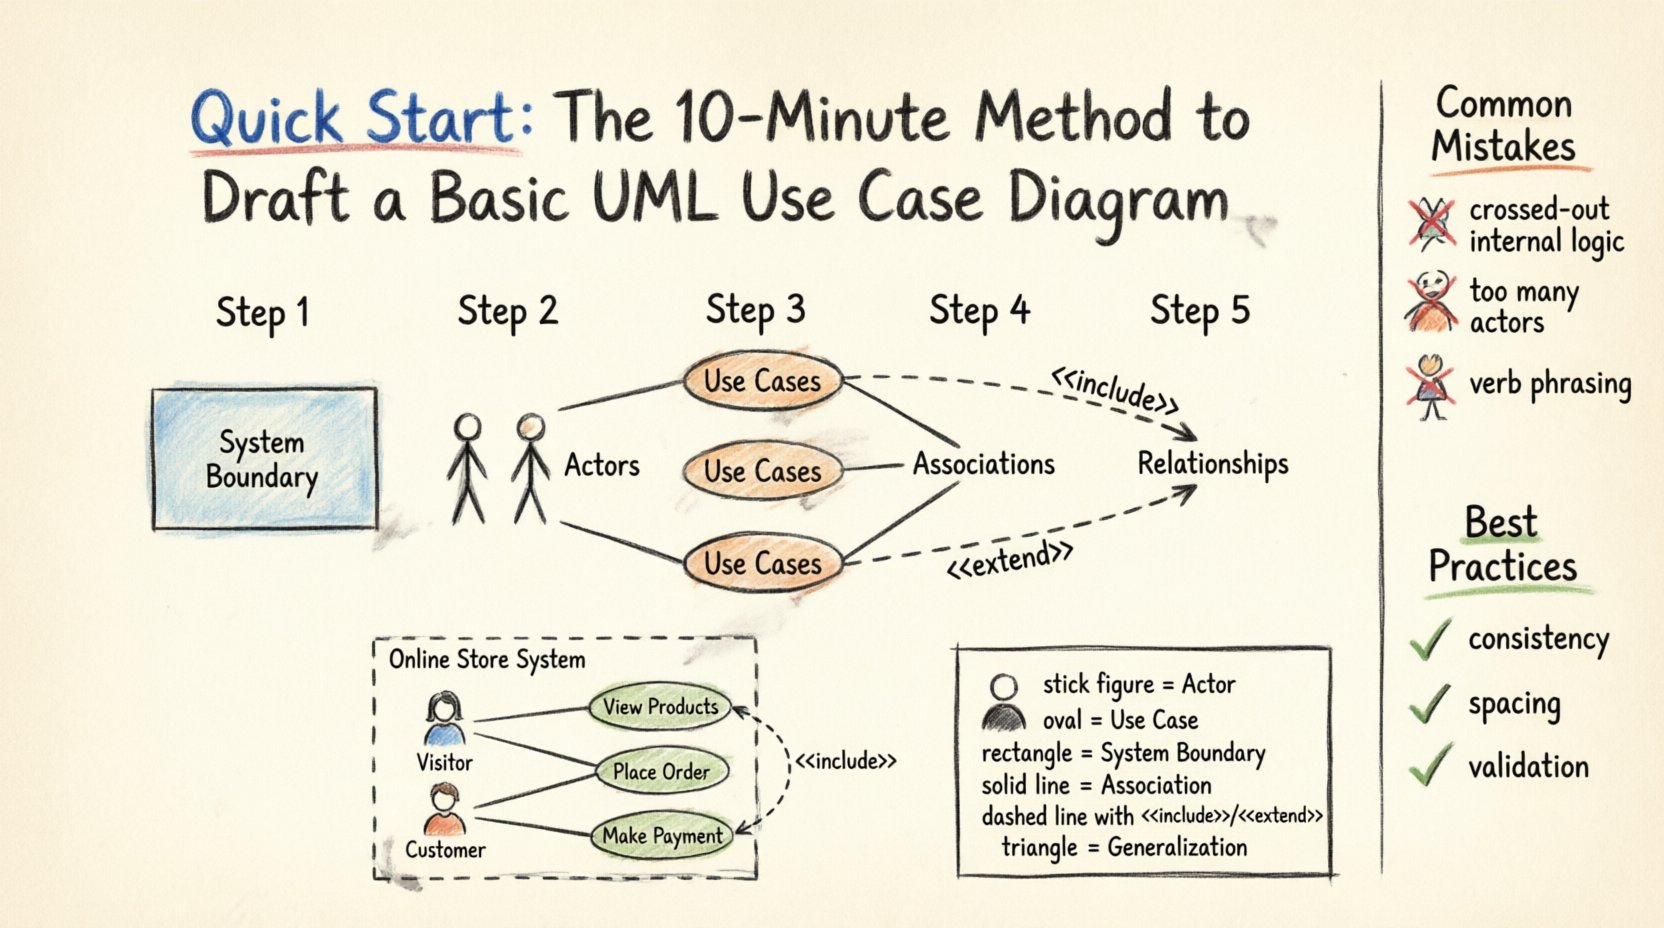
💡 Practical Example: Online Store
Let us apply this method to a concrete scenario. Imagine a simple Online Store System.
1. System Boundary
Draw a rectangle labeled “Online Store System”.
2. Actors
- Visitor: Someone browsing without an account.
- Customer: Someone with an account who purchases items.
- Payment Processor: An external system handling transactions.
3. Use Cases
- View Products
- Search Products
- Place Order
- Make Payment
- Manage Account
4. Connections
- Visitor connects to “View Products” and “Search Products”.
- Customer connects to “Place Order” and “Manage Account”.
- “Make Payment” connects to “Place Order” (Include relationship).
- “Place Order” connects to “Payment Processor”.
This example demonstrates how simple elements combine to tell a story about system behavior. The diagram remains readable because each element has a distinct purpose.
⚠️ Common Mistakes to Avoid
Even experienced modelers make errors. Watch out for these frequent pitfalls to ensure your diagram remains valid and useful.
- Internal Logic Leakage: Do not draw internal processes inside use cases. Use Case Diagrams are about interactions, not internal workflows. If you need to show internal steps, use a Sequence Diagram or Activity Diagram.
- Too Many Actors: If you have more than five or six actors, consider grouping them. Too many stick figures create visual clutter.
- Verb Phrasing: Remember, use cases should be noun phrases. “Log In” is acceptable, but “Logging In” or “Clicking Login” is less standard.
- Crossing Lines: If lines cross extensively, the diagram becomes hard to read. Reorder actors or use cases to minimize intersections.
- Missing Boundary: Always draw the system boundary. Without it, it is unclear what functionality belongs to the system and what belongs to the user.
🛡️ Best Practices for Clarity
Adhering to a set of guidelines ensures your diagram communicates effectively across the team.
- Consistency: Use the same naming convention throughout. If you use “Customer” in one place, do not switch to “User” elsewhere.
- Spacing: Keep adequate space between elements. Crowded diagrams are difficult to maintain.
- Hierarchy: If a use case is very complex, consider breaking it down into a sub-diagram. This keeps the main view high-level.
- Validation: Walk through the diagram with a stakeholder. Ask if the flow makes sense. If a user cannot trace their actions, the diagram needs adjustment.
- Version Control: Treat the diagram as a living document. Update it as requirements change. A static diagram loses value over time.
🔄 Integrating with Other Models
A Use Case Diagram is rarely used in isolation. It serves as a foundation for other artifacts.
- Use Case Descriptions: Each oval in the diagram should ideally have a written description detailing preconditions, postconditions, and the main flow of events.
- Activity Diagrams: Use these to show the step-by-step logic within a specific use case.
- Sequence Diagrams: Use these to model the time-based interaction between objects during a use case.
- Class Diagrams: Use these to define the data structures required to support the use cases.
By linking the diagram to these other models, you create a cohesive documentation suite. The Use Case Diagram acts as the entry point, guiding the reader to the specific details they need.
📊 Analyzing the System Scope
One of the primary benefits of this diagram is scope management. It clearly delineates what is in scope and what is out of scope for the current release.
- In Scope: Any use case inside the boundary is a requirement for this version.
- Out of Scope: If a feature is mentioned verbally but not drawn, it is not part of the current contract.
- Future Enhancements: Use cases that are planned but not ready can be noted outside the boundary or marked differently to indicate deferred status.
This clarity prevents “feature creep” during development. Developers know exactly what to build, and testers know exactly what to verify. The visual nature of the diagram makes it easier to spot gaps in requirements than a text-based list.
🧩 Refining the Diagram
After the initial draft, review the diagram for quality.
- Check Connectivity: Ensure every use case has at least one actor associated with it. An isolated use case indicates a function nobody uses.
- Check Completeness: Ensure every actor has at least one use case. An isolated actor indicates a role with no defined purpose.
- Check Logic: Trace the paths. Can a “Guest” access “Manage Account”? If not, the association should not exist.
- Check Labels: Are all labels clear? Can a non-technical stakeholder understand the diagram without explanation?
Refining is not about making it look pretty; it is about making it accurate. A diagram that is technically correct but unreadable fails its purpose.
📝 Conclusion
Building a UML Use Case Diagram is a foundational skill for system design. It forces clarity in thinking and communication. By following the 10-minute method outlined here, you can quickly establish a visual contract between stakeholders and developers. Remember that the goal is not perfection, but understanding.
Focus on the core interactions. Keep the scope defined. Avoid unnecessary complexity. With practice, drafting these diagrams becomes an intuitive part of your analysis workflow. This visual language bridges the gap between business needs and technical implementation, ensuring everyone is aligned on the system’s capabilities.
Use this guide as a reference when starting your next project. The time invested in creating a clear diagram pays dividends in reduced rework and clearer expectations. Start drawing, validate early, and keep your models aligned with reality.