
In the landscape of software architecture, visual modeling serves as the bridge between abstract requirements and concrete implementation. Two of the most frequently cited artifacts in this process are the Sequence Diagram and the State Diagram. While both fall under the umbrella of Unified Modeling Language (UML), they serve distinct purposes. Confusion often arises when teams attempt to use one to solve the problems intended for the other. This guide provides a technical breakdown of each, highlighting their unique capabilities and appropriate applications.
📉 Understanding Sequence Diagrams
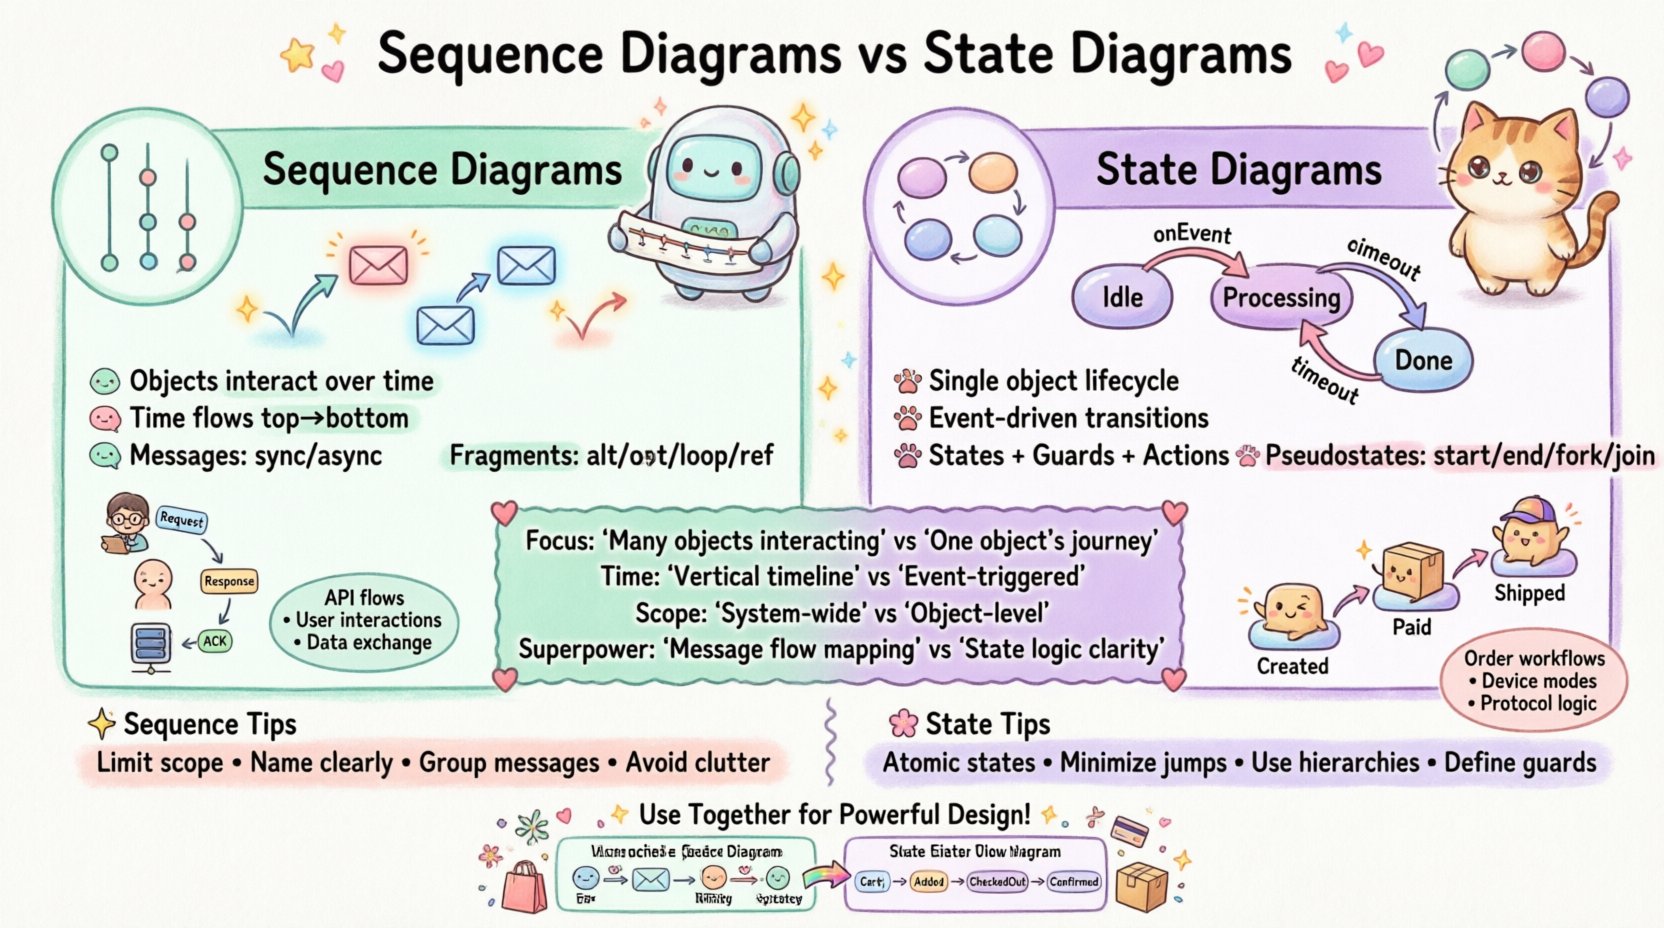
A Sequence Diagram is a type of Interaction Diagram. Its primary function is to illustrate how objects in a system interact with one another over a period of time. It is horizontal, with time flowing vertically from top to bottom. This visualizes the flow of messages between participating objects.
Core Components
- Lifelines: Vertical dashed lines representing individual objects, actors, or system components. Each lifeline has a specific identity within the context of the interaction.
- Activation Bars: Rectangles on a lifeline indicating the period during which an object is performing an action or is actively processing a message. This shows the duration of execution.
- Messages: Arrows connecting lifelines. These represent method calls, data returns, or signal transmissions.
- Return Messages: Dashed arrows pointing back to the sender, indicating the completion of a synchronous call.
Message Flows
Understanding the direction and type of message is critical for accurate modeling.
- Synchronous Calls: The sender waits for the receiver to complete the task before continuing. Represented by a solid line with a filled arrowhead.
- Asynchronous Calls: The sender continues processing without waiting for the receiver. Represented by a solid line with an open arrowhead.
- Self-Loops: An object calling a method on itself. This is common for internal processing logic.
Interaction Fragments
Real-world logic is rarely linear. Sequence diagrams support fragments to handle complexity:
- alt (Alternative): Used for if/else logic where only one path is taken based on a condition.
- opt (Optional): Indicates a block that may or may not occur.
- loop: Represents repetitive behavior, such as iterating through a collection.
- ref: References another sequence diagram to reduce clutter in complex systems.
🔄 Understanding State Diagrams
A State Diagram, often called a State Machine Diagram, focuses on the lifecycle of a single object. It describes the distinct conditions or states an object can exist in, and how it moves between these states in response to events.
Core Components
- States: Represented by rounded rectangles. A state defines a condition during which an object satisfies some invariant, performs an activity, or waits for an event.
- Transitions: Arrows connecting states. They represent the movement from one state to another triggered by an event.
- Events: The trigger that causes a transition. Examples include userClick, timeOut, or dataReceived.
- Guard Conditions: Boolean expressions attached to transitions. The transition only occurs if the condition evaluates to true.
Transitions and Events
The movement logic is governed by specific patterns:
- Entry Actions: Code executed immediately upon entering a state (e.g., onEntry: openConnection).
- Exit Actions: Code executed immediately before leaving a state (e.g., onExit: closeConnection).
- Do Activities: Ongoing processes that run while the object remains in a specific state (e.g., onEntry: startTimer).
Pseudostates
To manage complexity, State Diagrams utilize special nodes:
- Initial Node: The starting point of the diagram, usually a solid black circle.
- Final Node: The termination point, usually a solid circle with a surrounding ring.
- Fork: Splits a single transition into multiple parallel transitions.
- Join: Merges multiple parallel transitions into a single path.
📊 Key Differences at a Glance
The following table outlines the structural and functional distinctions between the two models.
| Feature | Sequence Diagram | State Diagram |
|---|---|---|
| Focus | Interaction between multiple objects over time. | Behavior of a single object over its lifecycle. |
| Time Axis | Vertical (Top to Bottom). | Not explicitly time-based; event-driven. |
| Scope | System-wide or component interaction. | Object-level internal logic. |
| Primary Element | Messages and Lifelines. | States and Transitions. |
| Best For | API flows, user interactions, data exchange. | Order processing, workflow logic, protocol states. |
| Complexity | High when many objects interact. | High when many states exist (State Explosion). |
🛠️ When to Use Each Model
Choosing the right diagram depends on the problem you are trying to solve. Using a State Diagram to map out an API call flow often results in a tangled mess. Conversely, using a Sequence Diagram to model a login workflow might miss critical validation states.
Use Sequence Diagrams For:
- API Endpoints: Visualizing the request-response cycle between a client and a server.
- Integration Points: Mapping how third-party services communicate with your core system.
- Exception Handling: Showing how errors propagate through the system layers.
- Performance Bottlenecks: Identifying where objects wait for responses (synchronous blocking).
Use State Diagrams For:
- Order Lifecycle: Tracking an order from Pending to Shipped to Delivered.
- Device Modes: Defining the states of a hardware component (e.g., Idle, Active, PowerSaving).
- Form Validation: Managing the state of a multi-step form wizard.
- Protocol Logic: Defining the handshake process for network connections.
✍️ Best Practices for Clarity
Diagrams become technical debt if they are too complex or ambiguous. Adhere to these standards to maintain value.
For Sequence Diagrams
- Limit Scope: Do not attempt to model every single line of code. Focus on the happy path and major error paths.
- Name Objects Clearly: Use descriptive names for lifelines (e.g., PaymentService instead of Object1).
- Group Messages: Use frames to group related interactions rather than drawing a single long vertical line.
- Avoid Clutter: If a diagram exceeds one screen, split it into sub-diagrams using the ref fragment.
For State Diagrams
- Keep States Atomic: A state should represent a single coherent condition, not a complex process.
- Minimize Cross-Links: Avoid transitions that jump between distant states without clear logical progression.
- Use Hierarchical States: For complex objects, nest states within super-states to reduce visual noise.
- Define Guards Explicitly: Ensure every transition has a clear condition or default path.
⚠️ Common Pitfalls to Avoid
Even experienced architects make mistakes when modeling. Recognizing these patterns early prevents rework.
Pitfall 1: Mixing Concerns
Do not try to show both interaction flow and state changes in a single diagram. If you need to show that a User object moves to a LoggedOut state during a sequence, draw two separate diagrams. Mixing them creates cognitive overload.
Pitfall 2: The “Spaghetti” State Machine
When a single object has too many states, the diagram becomes unreadable. If you have more than 20 states, consider refactoring the design or using composite states.
Pitfall 3: Ignoring Asynchrony
In Sequence Diagrams, assuming all messages are synchronous leads to incorrect performance estimates. Clearly mark asynchronous calls to indicate non-blocking behavior.
Pitfall 4: Over-Modeling
Not every object needs a diagram. Focus on complex logic. Simple data carriers (DTOs) rarely require detailed state modeling.
🔗 Integrating Both in System Design
The most robust designs utilize both diagrams in tandem. They provide complementary views of the same system.
Example Scenario: Online Checkout
- Sequence Diagram: Shows the CartService talking to the PaymentGateway and the NotificationService. It details the timing of the API calls.
- State Diagram: Shows the Order object. It defines how the order moves from Created to Paid to Shipped, and what happens if the payment fails.
By using the Sequence Diagram, developers understand the external contract. By using the State Diagram, developers understand the internal constraints. Together, they ensure the system is both communicative and logically sound.
❓ Frequently Asked Questions
Can I use Sequence Diagrams for backend logic?
Yes, but only for interaction flow. If the backend logic involves complex internal state changes, a State Diagram is more appropriate.
Are State Diagrams only for software?
No. They apply to hardware controllers, workflow processes, and even business rules management systems.
Which diagram is better for documentation?
It depends on the audience. For developers implementing features, State Diagrams are often more valuable for understanding logic constraints. For stakeholders reviewing integration, Sequence Diagrams are clearer.
How do I handle version control for diagrams?
Treat diagrams as code. Store them in your repository alongside source code. Use versioning to track changes in logic over time.
📝 Summary of Differences
Clarity in system design comes from choosing the right tool for the job. Sequence Diagrams excel at mapping the how of interactions between components over time. State Diagrams excel at mapping the what of an object’s behavior across its lifecycle.
By distinguishing between message flow and state transition, teams can reduce ambiguity. Use Sequence Diagrams to validate integration points. Use State Diagrams to validate business rules. Combining these approaches creates a comprehensive blueprint that supports both development and maintenance.
Effective modeling is not about drawing pretty pictures; it is about creating a shared understanding of system behavior. Apply these principles to ensure your architecture remains robust and understandable.