
Software design is the backbone of any robust application. Before writing a single line of code, architects and developers must visualize how a system behaves. Unified Modeling Language (UML) serves as the standard notation for this visualization. Among the many diagram types available, two stand out for modeling behavior: the State Machine Diagram and the Sequence Diagram. Understanding the distinction between these tools is crucial for effective system analysis.
This guide explores the specific purposes, components, and use cases of both diagram types. We will examine when to use a state representation versus a chronological interaction flow. By the end, you will have a clear framework for selecting the right diagram for your project needs. No jargon without explanation, just clear technical guidance.
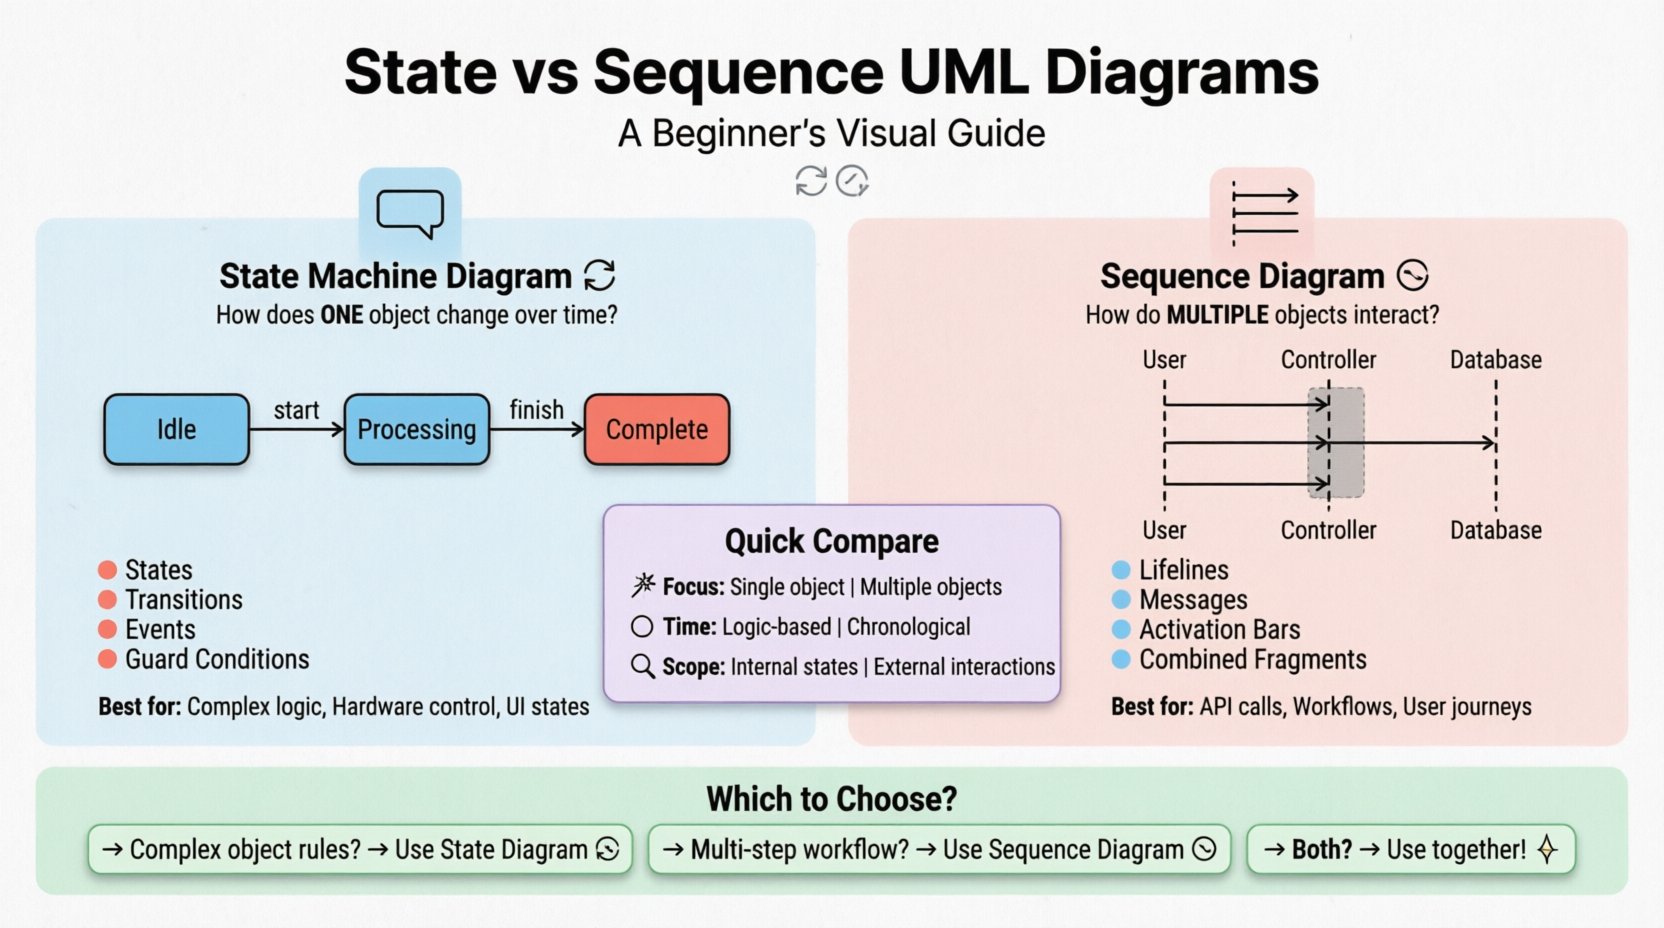
Understanding the State Machine Diagram 🔄
A State Machine Diagram, often called a Statechart Diagram, focuses on the lifecycle of a single object or a system. It answers the question: “How does this specific entity change its condition over time?” It is particularly useful for objects that have distinct modes of operation, such as an order in an e-commerce system or a traffic light.
Core Components 🧩
To construct a state diagram, you must understand the fundamental building blocks. These elements define the logic flow without relying on time, but rather on events.
- States: Represented as rounded rectangles. A state defines a condition where the object meets some criterion or waits for an event. Examples include Idle, Processing, or Locked.
- Initial State: A solid black circle. This marks the starting point of the lifecycle.
- Final State: A black circle with a surrounding ring. This indicates the termination of the object’s lifecycle.
- Transitions: Directed arrows connecting states. They represent the movement from one state to another triggered by an event.
- Events: The triggers that cause a transition. These can be signals, messages, or time-based triggers.
- Actions: Activities performed during a transition or while residing in a state. These are often labeled on the arrow (transition) or inside the state box.
- Guard Conditions: Boolean expressions written in square brackets
[condition]on a transition. The transition only occurs if the condition evaluates to true.
When to Use State Diagrams 🎯
These diagrams are ideal for modeling complex logic where the history or current status dictates future behavior. Consider a login system. The system cannot accept a password unless it is in the Waiting state. If it is in the Locked state, it requires a reset event.
- Complex Business Logic: When rules depend heavily on the current status of an entity.
- Hardware Control: Devices often have specific operational modes (On, Off, Sleep, Charging) that need clear definition.
- User Interface States: Defining how a form behaves when a user interacts with it (e.g., Submitting, Validating, Success, Error).
Understanding the Sequence Diagram ⏱️
In contrast, a Sequence Diagram focuses on interaction. It visualizes the chronological exchange of messages between objects or actors. It answers the question: “How do these components communicate to achieve a specific goal?” This diagram is essential for understanding the flow of data and control across different parts of a system.
Core Components 🧩
Sequence diagrams are laid out horizontally to represent time flowing downwards. The key elements include:
- Lifelines: Vertical dashed lines representing an object or participant. The top of the line represents the object’s creation, and the bottom represents its destruction.
- Messages: Horizontal arrows between lifelines. They represent method calls, signals, or data transfers. Solid arrows indicate synchronous calls, while open arrows indicate asynchronous messages.
- Activation Bars: Thin rectangles on a lifeline indicating the period during which the object is performing an action or waiting for a response.
- Combined Fragments: Boxes with frames labeled with operators like
alt(alternative),opt(optional), orloop(iteration). These show conditional logic or repetitive actions within the sequence. - Return Messages: Dashed arrows pointing back to the sender, indicating a return value or completion of a call.
When to Use Sequence Diagrams 🎯
Use this type of diagram when the order of operations is critical. It is the go-to choice for documenting API interactions, database transactions, or multi-step workflows involving multiple actors.
- API Integration: Mapping out how a frontend requests data from a backend service.
- Database Transactions: Showing the commit, rollback, and read operations across a session.
- Use Case Scenarios: Detailing the specific steps a user takes to complete a feature.
- System Integration: Visualizing how distinct microservices talk to one another during a specific event.
Comparing State Machine vs. Sequence Diagrams 📋
While both diagrams describe behavior, their perspective differs significantly. One looks at the internal status, while the other looks at the external interaction. The following table breaks down the structural and functional differences.
| Feature | State Machine Diagram | Sequence Diagram |
|---|---|---|
| Primary Focus | Internal state changes of a single object | Interaction flow between multiple objects |
| Time Perspective | Achronological (Logic-based) | Chronological (Time-based) |
| Scope | Single entity lifecycle | Multi-entity collaboration |
| Key Elements | States, Transitions, Events | Lifelines, Messages, Activation |
| Best Used For | Complex logic, modes, status rules | Workflows, API calls, user journeys |
| Visual Layout | Nodes and Edges (Graph) | Vertical Lines and Horizontal Arrows |
How to Choose the Right Diagram 🧭
Selecting the appropriate modeling tool depends on the information you need to convey to stakeholders. Ambiguity in design leads to implementation errors. Follow this decision framework to ensure clarity.
Scenario 1: Complex Object Logic
If you are designing a feature like a payment processor, the object must handle different statuses: Authorized, Captured, Refunded, Failed. A sequence diagram would show the steps to authorize, but it would not clearly show that a payment cannot be refunded if it is in the Failed state. Use a State Machine Diagram here to enforce business rules.
Scenario 2: Multi-Step Workflow
If you are documenting a user registration process involving an Email Service, a Database, and the User Interface, the focus is on the handoff of data. The state of the user object matters less than the fact that the database must confirm receipt before the email is sent. Use a Sequence Diagram to map this flow.
Scenario 3: Hybrid Approach
In complex systems, both are often necessary. You might use a State Machine to define the lifecycle of a Order object, and a Sequence Diagram to show how the Order object interacts with the PaymentGateway when it enters the Processing state.
Common Pitfalls and Best Practices ⚠️
Even experienced designers make mistakes when modeling. Avoid these common errors to maintain diagram quality.
Pitfalls in State Diagrams
- Too Many States: If a diagram has more than 20 states, it becomes unreadable. Consider breaking the object into sub-objects or using hierarchical states.
- Mixing Logic and Flow: Do not use state diagrams to show the order of operations across different objects. Keep the scope to one entity.
- Missing Events: Ensure every state has a defined exit path or an error handling path (e.g., a timeout event).
Pitfalls in Sequence Diagrams
- Too Many Participants: Limit the number of lifelines to 10-15. If you have more, consider grouping them or splitting the diagram into fragments.
- Ignoring Asynchrony: Differentiate between blocking calls and fire-and-forget messages. Using solid arrows for everything can imply incorrect timing constraints.
- Over-Engineering: Do not model every single getter/setter method unless they are critical to the logic. Focus on the high-value interactions.
Best Practices for Maintenance 🛠️
Diagrams are not static documents. They must evolve with the software. Keep these guidelines in mind for long-term maintainability.
- Consistent Naming: Use the same terminology in the diagram as you do in the codebase. If the code calls it UserSession, do not label the diagram box SessionObject.
- Layered Detail: Start with a high-level view showing major components. Create detailed diagrams for specific modules. Avoid cramming all detail into one page.
- Regular Reviews: Update diagrams during code reviews. If the implementation changes, the diagram should reflect that change immediately.
- Use Standard Symbols: Stick to UML standard notation. Custom symbols confuse readers who are trained on the industry standard.
Integration in the Development Lifecycle 🔗
These diagrams are not just for the design phase. They serve as documentation for testing and onboarding.
- For Testing: Test cases can be derived directly from State Diagrams. Each transition represents a potential test path. Sequence Diagrams help define the inputs and outputs for integration testing.
- For Onboarding: New team members can use Sequence Diagrams to understand how data moves through the system. State Diagrams help them understand the rules governing specific entities.
- For Architecture: Architects use State Diagrams to identify potential bottlenecks in state transitions (e.g., a long-running process blocking other events).
Deep Dive: Syntax and Notation Details 🔍
To ensure precision, understanding the exact syntax is vital. Let’s look at specific notation rules.
State Machine Notation
When labeling a transition, use the format Event [Guard] / Action.
click: The event name.[balance > 0]: The guard condition.withdrawMoney(): The action performed.
State names should be nouns (e.g., Idle, Active), while events should be verbs or noun phrases (e.g., Login, Timeout).
Sequence Notation
Messages are labeled with the operation name. If a return value is significant, include it on the dashed return arrow.
- Synchronous:
requestOrder(id)(Solid arrow). - Asynchronous:
logEvent()(Open arrow). - Self-Call: An arrow looping back to the same lifeline.
Use the alt frame to represent if/else logic. Use the loop frame for for loops. This keeps the diagram clean compared to drawing every single iteration.
Final Thoughts on Modeling 🎓
Choosing between State Machine and Sequence diagrams is not about picking the “better” tool. It is about picking the right tool for the specific problem. State diagrams excel at defining the internal rules of an entity. Sequence diagrams excel at defining the collaborative flow between entities.
By mastering these two representations, you gain the ability to document complex systems with clarity. You reduce ambiguity for developers and provide a clear roadmap for testers. Remember that the goal is communication, not just drawing shapes. Keep your diagrams simple, accurate, and up to date.
Start by modeling the critical paths in your current project. Identify where state changes are complex and where interaction flows are messy. Apply the appropriate diagram type. Over time, this practice will improve your architectural decisions and the overall quality of your software deliverables.