
“A picture is worth a thousand words” — but when it comes to software architecture, a well-structured diagram can be worth thousands of lines of code and hours of confusion. The C4 Model, created by software architect Simon Brown, provides a simple, scalable, and powerful way to communicate software architecture through a hierarchical, zoomable approach using four core diagram types. This article dives deep into the principles, structure, use cases, best practices, and real-world application of the C4 Model — all backed by real examples and insights from the field.*
🔍 What Is the C4 Model?
The C4 Model is a hierarchical, zoomable approach to documenting and visualizing software architecture. It breaks down complex systems into four levels of abstraction — each representing a different level of detail — allowing teams to communicate architecture effectively across technical and non-technical audiences.
The name “C4” comes from the four core diagram types:
-
Context
-
Containers
-
Components
-
Code
These levels follow a “zoom-in” metaphor:
Start broad (high-level context), then progressively drill down into more granular detail — only where necessary.
This avoids the common pitfall of creating one massive, unreadable diagram that tries to show everything at once.
🧭 The Four Levels of Abstraction
Let’s explore each level in detail, including their purpose, typical content, audience, and recommended usage.
| Level | Diagram Type | Abstraction Level | Purpose |
|---|---|---|---|
| 1 | System Context | High-level | Show the big picture: who uses the system, what it connects to |
| 2 | Containers | Medium | Break down the system into deployable/runnable units |
| 3 | Components | Detailed | Show internal structure of a container — its key components |
| 4 | Code | Implementation | Show implementation details (classes, methods, sequences) |
✅ Level 1: System Context Diagram
“What is this system? Who uses it? What does it connect to?”
🎯 Purpose
-
Establish context: Where does the system sit in the wider ecosystem?
-
Define boundaries: What’s inside the system? What’s outside?
-
Help non-technical stakeholders understand the system’s role.
📌 Key Elements
-
One central box: The software system (e.g., “Internet Banking System”)
-
Actors (people or systems): Users or external systems (e.g., “Personal Customer”, “Mainframe Banking System”, “Email Service”)
-
Arrows: Show interactions (e.g., “sends transaction data”, “logs in via”)
🎨 Example (Internet Banking System)
+---------------------+
|  Internet Banking   |
|     System          |
|  (Web/Mobile App)   |
+----------+----------+
           |
           | (interacts with)
           v
+---------------------+
|  Mainframe Banking  |
|    System           |
+----------+----------+
           |
           | (sends alerts)
           v
+---------------------+
|  Email Notification |
|    Service          |
+---------------------+

+---------------------+
|  Personal Customer  |
|  (User)             |
+---------------------+

+---------------------+
|  Business Customer  |
|  (User)             |
+---------------------+
👥 Audience
-
Product managers
-
Stakeholders
-
New team members
-
Executives
-
Cross-functional teams
📊 Cardinality
✅ 1 × System Context diagram per software system
💡 Tip: This is often the first diagram you should create when starting a new project.
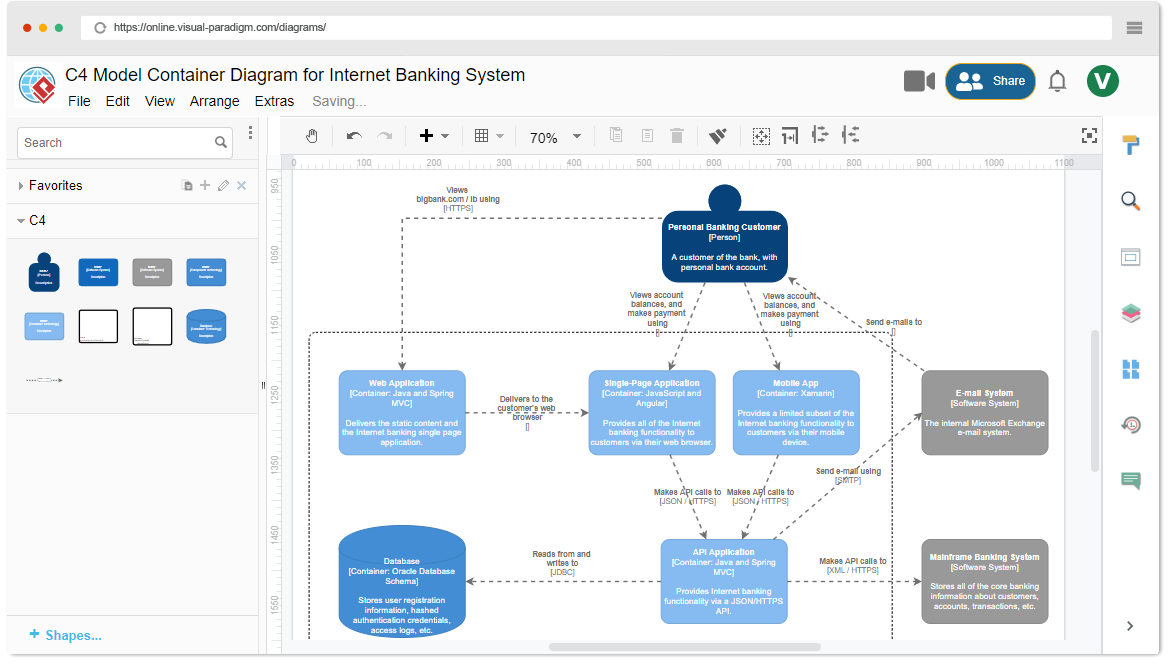
✅ Level 2: Container Diagram
“How is the system built? What are its major components?”
🎯 Purpose
-
Zoom into the software system from Level 1.
-
Identify deployable/runnable units (containers) and their technology stack.
-
Show how containers interact with each other.
📌 Key Elements
-
Containers: Deployable units (e.g., Web App, Mobile App, API Service, Database, Message Broker)
-
Technology labels: e.g., “Spring Boot”, “React”, “PostgreSQL”, “Kafka”
-
Arrows: Show interaction patterns (e.g., HTTP/REST, gRPC, JDBC, AMQP)
🎨 Example (Internet Banking System)
+---------------------+
|   Mobile App        | ← (React Native, iOS/Android)
+----------+----------+
           |
           | HTTP/REST
           v
+---------------------+
|   API Application   | ← (Spring Boot, Java)
+----------+----------+
           |
           | JDBC
           v
+---------------------+
|   PostgreSQL DB     | ← (PostgreSQL)
+----------+----------+
           |
           | (via Kafka)
           v
+---------------------+
|   Message Broker    | ← (Apache Kafka)
+---------------------+
👥 Audience
-
Developers
-
DevOps engineers
-
Architects
-
QA engineers
📊 Cardinality
✅ 1 × Container diagram per software system
(Most commonly used level — often the only diagram needed for many projects)
💡 Best Practice: Use standardized icons (e.g., from C4 Model’s official icons) to improve readability.
✅ Level 3: Component Diagram
“How is this container structured internally?”
🎯 Purpose
-
Drill down into one specific container (e.g., the API Application).
-
Show high-level internal structure — major components, their responsibilities, and interactions.
-
Identify modularity, separation of concerns, and dependencies.
📌 Key Elements
-
Components: Logical building blocks (e.g., “Authentication Service”, “Transfer Service”, “Email Service”)
-
Dependencies: Arrows showing who calls whom (e.g., “Transfer Service” → “Account Repository”)
-
Labels: Include responsibility (e.g., “Handles fund transfers between accounts”)
🎨 Example (API Application Container)
+---------------------+
|   Controller Layer  | ← (REST controllers)
+----------+----------+
           |
           | (calls)
           v
+---------------------+
|  Business Logic     | ← (Service layer: TransferService, AccountService)
+----------+----------+
           |
           | (calls)
           v
+---------------------+
|  Data Access Layer  | ← (Repositories: AccountRepository, TransactionRepository)
+---------------------+
👥 Audience
-
Developers working within that container
-
Team leads
-
Technical reviewers
📊 Cardinality
🔁 0 to n × Component diagrams
(Only create for interesting or complex containers — e.g., the API service, not a simple frontend)
💡 Pro Tip: Avoid over-documenting. Focus only on architecturally significant components.
✅ Level 4: Code Diagram
“How is this component implemented?”
🎯 Purpose
-
Show implementation-level detail.
-
Reveal classes, interfaces, methods, or sequence of events.
-
Useful for complex logic, tricky algorithms, or design patterns.
📌 Common Types
-
UML Class Diagram (classes, inheritance, associations)
-
Sequence Diagram (step-by-step flow of method calls)
-
Source Code Snippets (for quick reference)
🎨 Example (Transfer Funds Use Case)
sequenceDiagram
    participant TransferService
    participant AccountRepository
    participant TransactionRepository

    TransferService->>AccountRepository: findAccountById()
    AccountRepository-->>TransferService: returns Account
    TransferService->>TransactionRepository: createTransaction()
    TransferService->>AccountRepository: updateBalance()
👥 Audience
-
Developers (especially when debugging or onboarding)
-
Reviewers of complex logic
-
Technical architects (only when needed)
📊 Cardinality
🚫 Rarely drawn by hand
✅ Often skipped entirely
✅ Usually replaced by actual source code
💡 Rule of Thumb: Only create code diagrams if you can’t explain it clearly in plain language or with simpler diagrams.
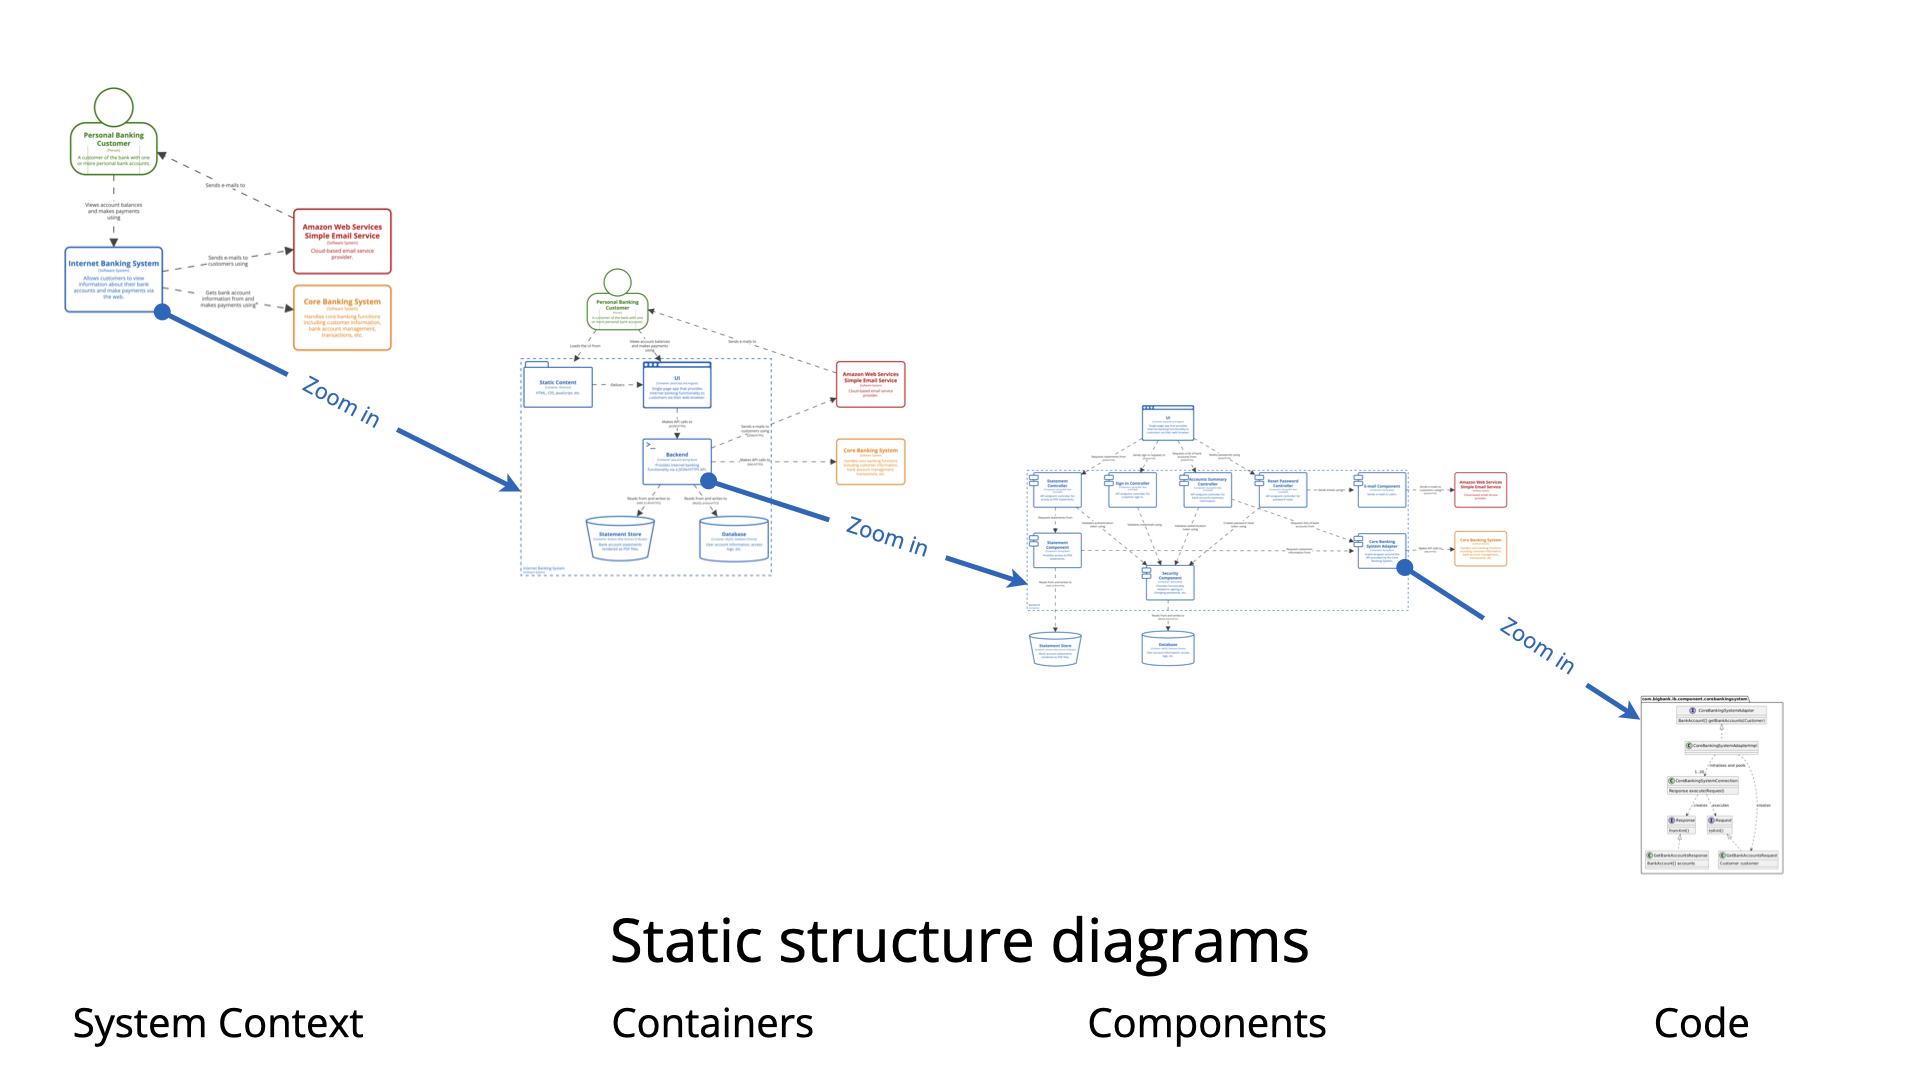
🔄 The Zoom Pattern: A Visual Metaphor
Think of the C4 Model as a digital zoom lens:
[Level 1: System Context] → [Level 2: Containers] → [Level 3: Components] → [Level 4: Code]
     (Bird’s-eye view)         (Closer look)           (Detailed view)         (Microscopic view)
This pattern ensures:
-
Clarity: Each diagram focuses on one level of abstraction.
-
Scalability: You don’t need to document everything at once.
-
Maintainability: Updates are localized — change a component? Only update its diagram.
🏗️ Best Practices & Pro Tips
| Practice | Why It Matters |
|---|---|
| Start with the System Context diagram | Sets the foundation. Everyone agrees on scope. |
| Use consistent naming and icons | Improves readability and professionalism. |
| Limit the number of containers | If you have more than 6–8, ask: “Are these really separate containers?” |
| Focus on architecture, not implementation | Avoid listing every microservice or every class. |
| Document only what matters | Don’t create component diagrams for trivial containers. |
| Use tools wisely | Tools like Excalidraw, Lucidchart, Draw.io, PlantUML, or C4-Tools (by Simon Brown) help automate and standardize diagrams. |
| Treat diagrams as living documents | Update them as the system evolves. |
🛠 Recommended Tools:
https://c4model.com/ – Official site with templates, icons, and examples
C4-Tools (GitHub): VS Code extension for C4 diagrams
PlantUML + C4 syntax: Generate diagrams via code
Excalidraw: Hand-drawn style for quick prototyping
🧩 When Should You Use Each Level?
| Level | When to Use | When to Skip |
|---|---|---|
| Context | ✅ Always — for any new system | ❌ Never (unless you’re building from scratch) |
| Containers | ✅ Always — for any non-trivial system | ❌ Only for very simple apps (e.g., a single-page static app) |
| Components | ✅ For complex, high-impact, or evolving containers | ❌ For simple or stable containers |
| Code | ✅ Only for tricky or non-obvious logic | ❌ Most of the time — just read the code |
✅ Most teams get 90% of the value from just Levels 1 and 2.
📌 Real-World Example: E-Commerce Platform
1. System Context Diagram
-
System: “Online Store Platform”
-
Actors: Customer, Admin, Payment Gateway, Inventory System, Email Service
-
Interactions: Customer places order → Payment Gateway → Inventory System → Email Service
2. Container Diagram
-
Frontend App (React, hosted on Vercel)
-
API Gateway (Node.js + Express)
-
Order Service (Java/Spring Boot)
-
Inventory Service (Python/FastAPI)
-
Database (PostgreSQL)
-
Message Queue (RabbitMQ)
3. Component Diagram (Order Service)
-
Order Controller
-
Order Service (business logic)
-
Payment Client
-
Inventory Client
-
Order Repository
4. Code Diagram (Optional)
-
Only if you’re explaining how order cancellation works with compensation transactions or distributed locks.
📚 Why C4 Works: The Core Principles
-
Simplicity – Uses only four levels, easy to learn.
-
Scalability – You can go deep into only the parts that matter.
-
Collaboration – Helps developers, architects, and stakeholders speak the same language.
-
Documentation – Provides a clear path from strategy to implementation.
-
Evolutionary – Evolves with the system — no need to rewrite all diagrams every time.
🎯 Conclusion: Why You Should Use the C4 Model
The C4 Model is not just a diagramming technique — it’s a mindset. It teaches us to:
-
Think hierarchically
-
Communicate effectively
-
Focus on what matters
-
Avoid over-documentation and analysis paralysis
Whether you’re designing a startup MVP or a large enterprise system, the C4 Model helps you start simple, zoom in only when needed, and stay focused on value.
📌 Further Reading & Resources
-
🌐 Official C4 Model Website: https://c4model.com
-
Abstractions – The core concepts
-
Diagrams – Examples and templates
-
Examples – Real-world systems
-
-
📚 Book: Software Architecture: The Hard Parts by Neal Ford & Matthew Phillips (includes C4 references)
-
🧩 Tool: C4-Tools for VS Code – Generate C4 diagrams from code
✅ Final Summary
| Level | Diagram Type | When to Use | Key Insight |
|---|---|---|---|
| 1 | System Context | Always | Who uses the system and what it connects to |
| 2 | Container | Always | What are the major components and their tech stack? |
| 3 | Component | Only when needed | How is this container structured internally? |
| 4 | Code | Rarely | Only for complex logic — otherwise, just read the code |
🔑 The real power of C4 lies not in the diagrams themselves, but in the conversation they enable.
📝 Remember:
“Good architecture is not about perfect diagrams — it’s about clear communication, shared understanding, and building systems that work.”
Start with C4, zoom in wisely, and keep it simple.
📌 Your Turn:
Next time you design a system, sketch the System Context and Container diagrams first. You’ll be surprised how much clarity you gain — and how much faster your team can align.
🚀 Happy modeling!
-
The Ultimate Guide to C4-PlantUML Studio: Revolutionizing Software Architecture Design: This resource explains how the studio combines AI-driven automation, the structural clarity of the C4 model, and the flexibility of PlantUML (an open-source UML tool) to solve documentation bottlenecks.
-
Ultimate Guide to C4 Model Visualization Using Visual Paradigm’s AI Tools: A comprehensive guide on leveraging specialized AI features to automate and enhance the creation of hierarchical C4 model diagrams for faster system design.
-
AI-Powered UML Class Diagram Generator by Visual Paradigm: This page details an advanced tool that automatically generates UML class diagrams from natural language descriptions, significantly streamlining the software design process.
-
Visual Paradigm – AI-Powered UML Sequence Diagrams: This article demonstrates how to produce professional UML sequence diagrams directly from text prompts using an integrated AI modeling suite.
-
Comprehensive Tutorial: Generating and Modifying C4 Component Diagrams with AI Chatbot: A step-by-step guide illustrating how to use a conversational assistant to create and refine the internal structure of software systems through the C4 model’s component level.
-
Major Upgrade to AI UML Component Diagram Generation in Visual Paradigm AI Chatbot: An official update detailing enhancements that make the AI chatbot an indispensable tool for generating modular UML component structures.
-
AI-Powered Sequence Diagram Refinement Tool | Visual Paradigm: This resource discusses how AI can automatically optimize and suggest improvements for existing sequence diagrams, ensuring structural correctness and clarity.
-
Beyond the Code: How AI Automates C4 Model Diagrams for DevOps and Cloud Teams: A detailed guide on using an AI assistant to automate the full C4 modeling lifecycle through simple conversational prompts, ensuring consistency across all abstraction levels.
-
AI Diagram Generator: Complete C4 Model Support: An announcement regarding the release of a specialized AI engine capable of automated creation of C4 model diagrams to support complex architectural documentation.
-
How AI Enhances Class Diagram Creation in Visual Paradigm: This blog post explores how the integration of AI automates and improves the accuracy of creating UML class diagrams, making software design faster for development teams.