
In the landscape of software development, the distance between a stakeholder’s vision and the final product is often paved with assumptions. These assumptions are the primary source of defects, scope creep, and frustration. When requirements are vague, developers make guesses, and stakeholders make promises that the code cannot keep. This misalignment creates technical debt before a single line of code is written.
One of the most effective methods to reduce this friction is the creation of sequence diagrams. These visual tools map out the interactions between system components over time. They transform abstract text into concrete logic, allowing teams to validate behavior before implementation begins. This guide explores the process of converting unclear requirements into precise diagrams that facilitate communication and reduce risk.
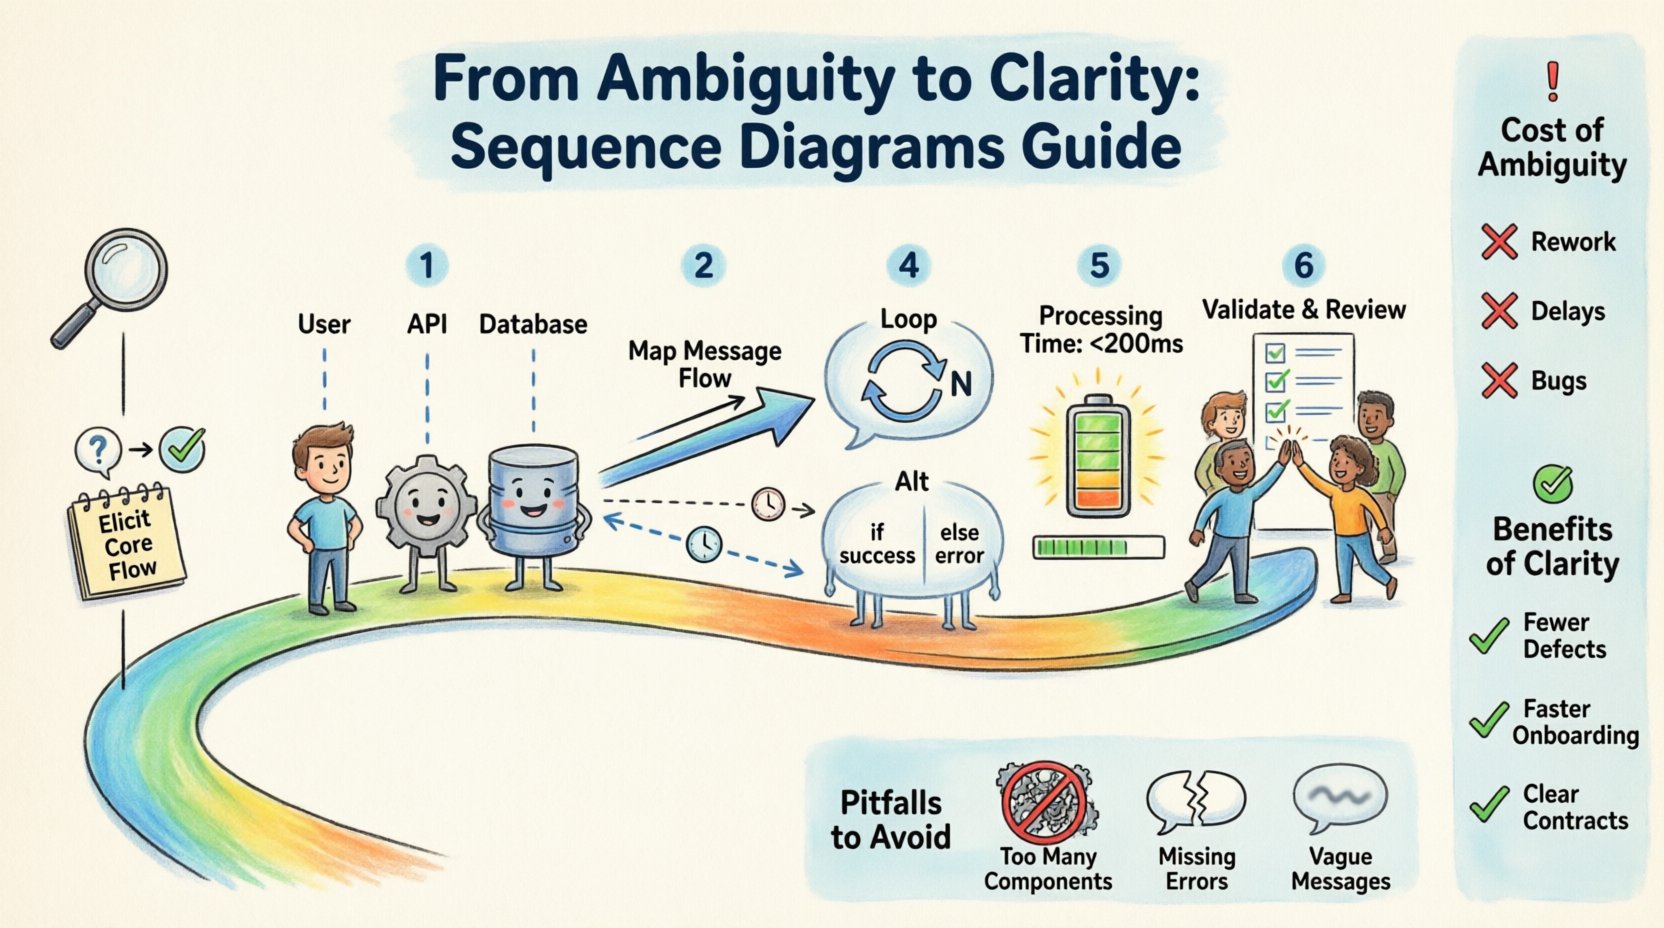
Understanding the Cost of Ambiguity 💸
Ambiguous requirements are not merely a nuisance; they are a financial liability. When a requirement states “The system should handle data efficiently,” it leaves the interpretation open to the developer’s discretion. One developer might optimize for speed, while another optimizes for memory usage. Without a clear definition of what “efficient” means in context, the resulting system may fail to meet actual business needs.
Consider the impact on the project lifecycle:
- Rework: Code written based on incorrect assumptions must be discarded or refactored later.
- Communication Overhead: Meetings are required to clarify intent, consuming valuable time.
- Testing Gaps: Test cases are built around the written spec, which may not match the intended behavior.
- Stakeholder Dissatisfaction: The delivered product feels different from what was promised.
By addressing ambiguity early through visual modeling, teams can catch logic errors during the design phase rather than the testing phase. The cost of fixing a diagram is negligible compared to the cost of fixing deployed code.
The Role of Sequence Diagrams in Clarification 📊
A sequence diagram is a type of interaction diagram that shows how processes operate with one another and in what order. It focuses on the flow of messages between objects or system components. Unlike a class diagram, which shows structure, a sequence diagram shows behavior over time.
When used correctly, these diagrams serve three primary functions:
- Validation: They allow stakeholders to verify that the logic matches their business rules.
- Specification: They provide a precise contract for developers to follow during implementation.
- Documentation: They create a lasting record of how the system is designed to work, aiding future maintenance.
Because they display time vertically, they are particularly effective at highlighting race conditions, missing error handling, and circular dependencies. This temporal aspect is crucial when requirements involve asynchronous events or complex user workflows.
Step 1: Eliciting the Core Flow 📝
Before drawing a single box or line, you must understand the primary use case. Ambiguity often stems from a lack of understanding about the specific scenario being modeled. Do not attempt to diagram the entire system at once. Focus on one specific interaction or user journey.
To extract this information, engage in structured conversations with stakeholders. Ask questions that force specificity:
- Who initiates the action? Is it a user, an external API, or a scheduled job?
- What triggers the process? Is it a button click, a file upload, or a timer event?
- What is the expected outcome? Does the system return a success message, an error code, or a data payload?
- What happens if things go wrong? This is where ambiguity often hides. Does the system retry? Does it rollback? Does it alert an administrator?
Document the answers in a narrative format first. A written story of the interaction helps identify gaps before visualizing the logic. If you cannot write a clear sentence about what happens next, you cannot draw a clear line on a diagram.
Step 2: Identifying Participants and Lifelines 👥
Once the narrative is clear, identify the actors involved in the interaction. In the context of a sequence diagram, these are the lifelines. A lifeline represents an individual participant in the system. These can be users, hardware devices, external services, or internal software modules.
Limit the number of lifelines to keep the diagram readable. A diagram with too many vertical lines becomes cluttered and loses its purpose. If a component is too complex, consider creating a separate diagram for it.
Common categories of lifelines include:
- Boundary Objects: Interfaces where users or external systems interact with the software (e.g., a Web Client, a Mobile App).
- Control Objects: Components that manage the logic and flow of the interaction (e.g., a Service Controller, a Business Logic Handler).
- Entity Objects: Components that store data or represent persistent information (e.g., a Database, a File System).
Label each lifeline clearly. Use the specific name of the component rather than generic terms like “System” or “User.” Precision in naming reduces confusion later.
Step 3: Mapping the Message Flow 📩
This is the core of the diagram. Messages represent the interactions between lifelines. They are drawn as horizontal arrows connecting the vertical lifelines. The position of the arrow along the vertical axis indicates the sequence of events.
When mapping the flow, distinguish between the type of message being sent:
- Synchronous Calls: The sender waits for the receiver to complete the action before continuing. Represent these with solid arrows.
- Asynchronous Calls: The sender does not wait for a response. Represent these with open arrows.
- Return Messages: The response from the receiver back to the sender. These usually point back to the left or are shown as dashed lines.
- Self-Invocations: When an object performs an action on itself. Draw the arrow looping back to the same lifeline.
Be specific about the data being exchanged. Instead of writing “send data,” write “send order details.” This forces the team to define the schema and the structure of the information.
Step 4: Handling Control Structures and Loops 🔄
Real-world requirements are rarely linear. They involve decision points, loops, and conditional logic. Sequence diagrams have specific notations to represent these scenarios without cluttering the visual flow.
The Alt (Alternative) Fragment
Use the Alt fragment to represent conditional logic. If a requirement states “If the user is logged in, show the dashboard; otherwise, show the login page,” this is an alternative path.
Divide the diagram into frames labeled Alt. Inside the frames, specify the condition for that path. This makes it clear which messages only occur under specific circumstances.
The Loop Fragment
Use the Loop fragment to represent repetitive actions. If a requirement involves processing a list of items, do not draw the same message 100 times. Instead, draw one instance and enclose it in a Loop frame with a condition like “for each item”.
The Opt (Optional) Fragment
Use the Opt fragment for actions that may or may not happen. This is useful for optional features or error recovery steps that are not part of the happy path.
Step 5: Refining with Activation Bars 🔋
Activation bars (also known as focus of control) indicate when an object is actively performing an operation. They are thin rectangles drawn on the lifeline.
Why are these important? They help identify when a system is blocking or waiting. If an activation bar extends too far down the timeline, it suggests a long-running operation that might block the user interface. This is a critical insight for performance requirements.
Use activation bars to clarify:
- When a component is processing data.
- When a component is waiting for an external response.
- When a component is idle between tasks.
This level of detail helps developers understand the concurrency requirements of the system. If multiple components have overlapping activations, it may indicate a need for threading or asynchronous processing.
Step 6: Validation and Review 🔍
Once the diagram is drafted, it must be validated. This is the step where ambiguity is truly resolved. Do not keep the diagram in a silo. Share it with the team and the stakeholders.
Conduct a walkthrough session. Walk through the diagram step-by-step, starting from the top. Ask the following questions:
- Does this flow match the business rule we discussed?
- Are there any steps missing that are critical for security?
- Is the error handling sufficient?
- Does this meet the performance expectations?
Encourage stakeholders to point out where the diagram does not match their mental model. This discrepancy is where the ambiguity lies. If they say, “Wait, I didn’t think about what happens if the network fails,” that is a requirement gap that must be filled.
Common Pitfalls to Avoid 🚫
Even with a solid process, mistakes happen. Being aware of common errors can save time and prevent misinterpretation.
| Pitfall | Impact | Solution |
|---|---|---|
| Too Many Components | Diagram becomes unreadable | Split into multiple diagrams or use grouping |
| Missing Error Paths | System crashes in production | Explicitly draw failure scenarios using Alt frames |
| Vague Messages | Developers guess the data structure | Name messages with specific data types |
| Ignoring Time | Performance bottlenecks ignored | Use activation bars to show duration |
| Static State Focus | Logic is unclear | Focus on behavior, not just object structure |
Collaboration Strategies for Teams 👥
Creating a sequence diagram is a collaborative effort. It is not a solitary task for a senior engineer. It should be a shared activity that builds a common understanding among the team.
Pair Modeling: Have two people work on the diagram together. One describes the requirement while the other draws. This forces immediate feedback and correction.
Whiteboarding: Before using digital tools, sketch the flow on a whiteboard. This lowers the barrier to entry and encourages rapid iteration. Digital tools often create a false sense of finality, whereas whiteboards invite change.
Living Documentation: Treat the diagram as a living document. As requirements change, update the diagram. If the diagram is outdated, it becomes a source of confusion rather than clarity. Ensure it is stored in the same repository as the code.
Transitioning from Diagram to Code 🧱
The final step is ensuring the diagram translates into code. This requires a direct mapping between the diagram elements and the codebase structure.
- Mapping Messages to Functions: Each message arrow should correspond to a function or method call in the code.
- Mapping Objects to Classes: Each lifeline should correspond to a class or service.
- Mapping Data to Models: The data passed in messages should match the data models or DTOs in the code.
During code reviews, check if the implementation follows the sequence diagram. If the code behaves differently, the diagram needs to be updated, or the code needs to be corrected. This cycle ensures consistency between design and implementation.
Measuring the Impact 📈
How do you know if this process is working? Look for indicators in the project metrics:
- Reduced Defect Rate: Fewer bugs related to logic errors in production.
- Faster Onboarding: New developers understand the system faster using the diagrams.
- Clearer Stories: User stories are more precise, requiring less clarification during sprint planning.
- Consistent API Contracts: External integrations work as expected because the flow was validated beforehand.
These metrics demonstrate that the time spent on design was an investment, not an overhead. It shifts the effort from fixing problems to preventing them.
Final Considerations for Success ✅
Creating clear sequence diagrams from ambiguous requirements is a skill that improves with practice. It requires patience, attention to detail, and a willingness to ask difficult questions. The goal is not to create a perfect artifact, but to create a shared understanding.
Remember that the diagram is a communication tool, not an end goal. If a diagram confuses someone, it has failed its purpose. Simplicity and clarity always take precedence over complexity and completeness. By focusing on the flow of information and the timing of interactions, teams can navigate the complexity of software development with confidence.
Start with the most critical paths. Document the happy path first, then the edge cases. Iterate until the logic holds up under scrutiny. Over time, this discipline becomes second nature, and the gap between requirements and reality narrows significantly.