
There is a persistent belief in the software industry that visual modeling requires an advanced academic background. Many professionals hesitate to engage with Unified Modeling Language (UML) notations because they feel the concepts are too abstract or theoretical. This perception creates a barrier to entry for business analysts, junior developers, and product owners who could greatly benefit from clear system visualization. The reality is that UML Use Case Diagrams are designed for human communication, not just academic exercise. You do not need a Master’s Degree to grasp the fundamentals. With a structured approach and a focus on practical application, anyone can learn to model system behavior effectively.
This guide breaks down the mechanics of Use Case Diagrams into digestible components. We will explore the core elements, the relationships between them, and the logic required to construct meaningful diagrams. By the end of this document, you will understand how these diagrams serve as a bridge between business requirements and technical implementation without requiring specialized higher education.
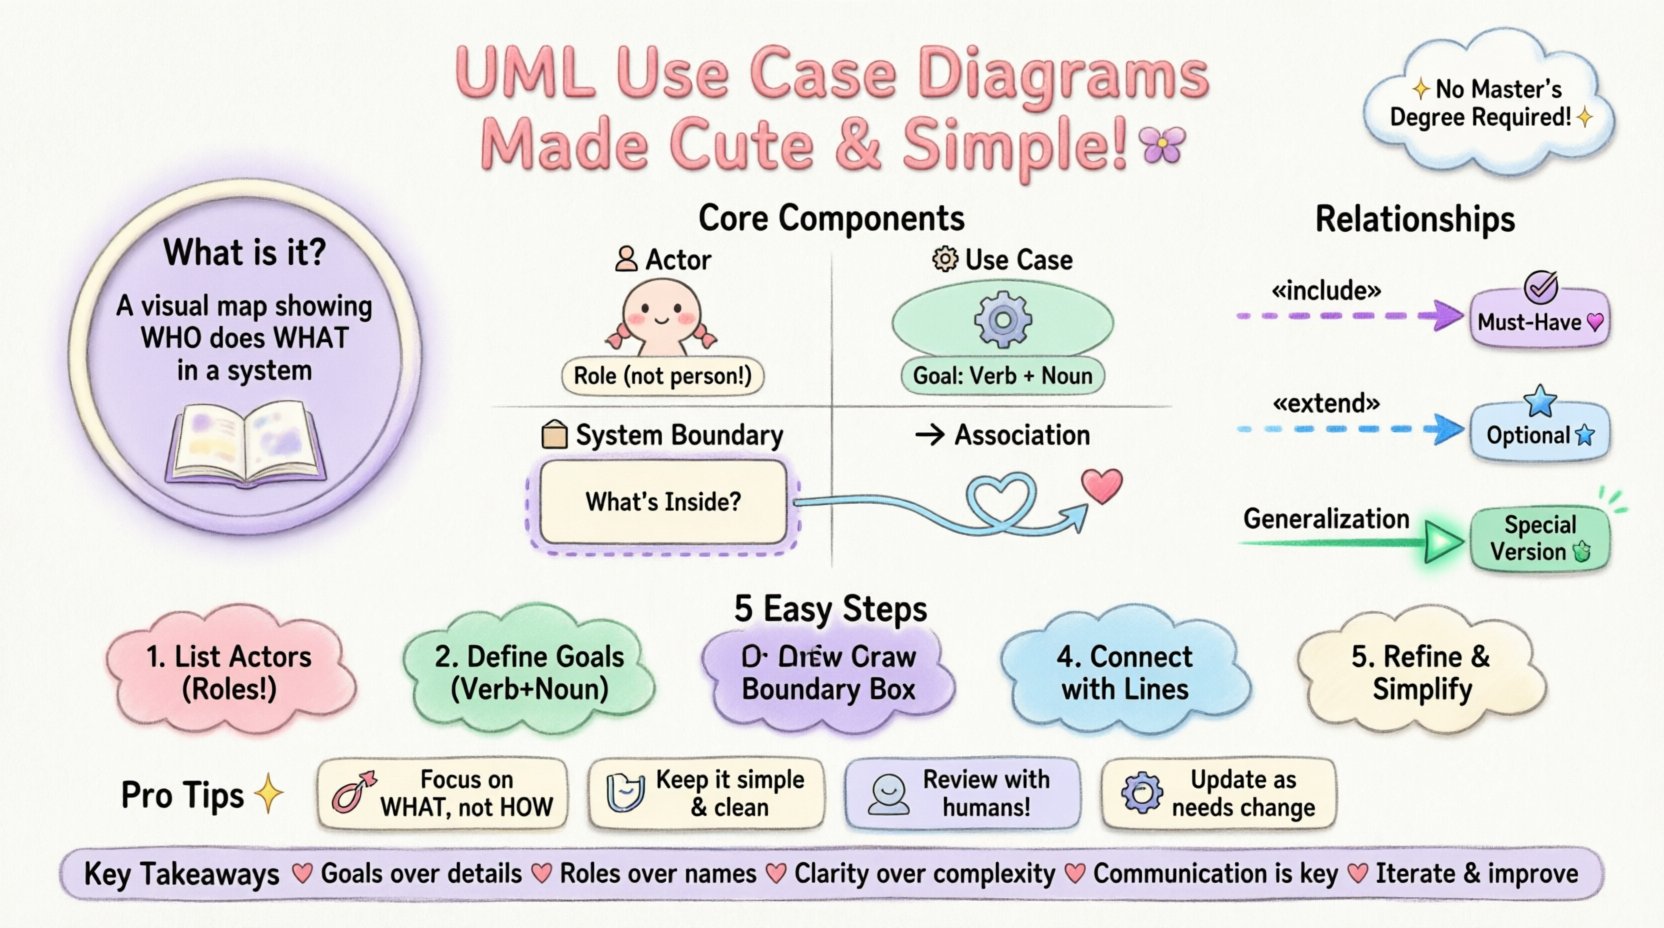
🔍 What Is a Use Case Diagram?
A Use Case Diagram is a behavioral diagram within the UML standard. Its primary purpose is to capture the functional requirements of a system from the perspective of an external user or actor. It answers the question: “What can the system do?” rather than “How does the system do it?” This distinction is crucial for high-level planning and stakeholder alignment.
Unlike data flow diagrams or sequence diagrams, which focus on the flow of data or time-based interactions, Use Case Diagrams focus on value. They map out the goals that different users want to achieve using the software. This makes them an essential tool for requirement gathering and scope definition.
🎯 Primary Objectives
- Visualizing Scope: Clearly define the boundaries of the system being modeled.
- Identifying Users: Determine who interacts with the system and what roles they play.
- Communicating Requirements: Provide a visual language that non-technical stakeholders can understand.
- Gap Analysis: Highlight missing functionality or areas where requirements are unclear.
🧱 Core Components of the Diagram
To build a valid Use Case Diagram, you must understand the four standard symbols used in the notation. Each symbol represents a specific concept within the system architecture. There is no complex mathematics involved, just logical representation.
1. The Actor (👤)
An Actor represents a role that a user or external system plays when interacting with the software. It is important to note that an Actor is not a specific person, but a role. For example, a “Customer” is an actor, but John Doe is a specific instance of that actor.
- Human Actors: Employees, customers, administrators, or guests.
- System Actors: External APIs, hardware devices, or other software systems that send or receive data.
- Representation: Typically drawn as a stick figure or a generic rectangle with the stereotype <<Actor>>.
2. The Use Case (⚙️)
A Use Case represents a specific unit of functionality or a goal that the actor wishes to accomplish. It is usually depicted as an oval or ellipse. The text inside the oval should describe the action in a verb-noun format (e.g., “Place Order” or “Generate Report”).
Key characteristics of a valid Use Case include:
- Atomic: It should represent a single, distinct goal.
- Value-Driven: The outcome must provide value to the actor.
- Independence: It should be describable without reference to the internal implementation details.
3. The System Boundary (🧱)
The System Boundary is a rectangle that encloses all the Use Cases. It defines the perimeter of the software or process being modeled. Anything outside the box is external; anything inside is part of the system.
This visual cue helps stakeholders understand what is included in the current project scope and what is excluded. It prevents scope creep during the design phase by clearly marking the limits of the system.
4. The Association (➡️)
An Association is a line connecting an Actor to a Use Case. It indicates that the actor interacts with that specific functionality. This relationship implies that the actor initiates the use case or receives information from it.
- Direction: In standard UML, the line is undirected, meaning communication can flow both ways.
- Labeling: Sometimes arrows are added to indicate the flow of control or data, though this is often optional for high-level diagrams.
🔗 Understanding Relationships
One of the most confusing aspects for beginners is the relationship between different Use Cases. UML provides specific notations to describe how use cases interact with each other. These relationships help reduce redundancy and organize complex logic.
Relationship Types Overview
| Relationship | Symbol | Meaning | Example |
|---|---|---|---|
| Include | ◄───«include»───► | Mandatory dependency. One use case must call another to complete its task. | “Withdraw Cash” includes “Authenticate User”. |
| Extend | ◄───«extend»───► | Optional behavior. One use case adds functionality to another under specific conditions. | “View Account” extends “Show Error Message”. |
| Generalization | ⬆ (Triangle) | Inheritance. A specialized actor or use case is a variation of a general one. | “Admin” is a specialized “User”. |
Deep Dive: Include vs. Extend
The distinction between Include and Extend is often a source of confusion. Understanding the difference is vital for accurate modeling.
Include (The “Must-Have”)
This relationship indicates that the base use case cannot function without the included use case. It is a mandatory step. If you remove the included use case, the base use case fails or loses meaning.
- Logic: “To do A, I must always do B.”
- Use Case: “Place Order” includes “Log In”.
- Reasoning: You cannot place an order without being authenticated.
Extend (The “Maybe”)
This relationship indicates optional behavior. The extended use case adds extra functionality to the base use case, but only if specific conditions are met.
- Logic: “To do A, I might do B if condition X is true.”
- Use Case: “Print Receipt” extends “Process Payment”.
- Reasoning: You pay for goods, but you only print a receipt if you ask for it.
📝 How to Construct a Diagram (Step-by-Step)
Creating a Use Case Diagram does not require specialized software knowledge, but it does require a structured process. Follow these steps to ensure accuracy and clarity.
Step 1: Identify the Actors
Start by listing everyone or everything that interacts with the system. Ask questions like:
- Who initiates the process?
- Who receives the output?
- Are there external systems involved?
Write these down as a list. Group similar roles together if necessary. Avoid listing specific names (e.g., “Jane Smith”) and stick to roles (e.g., “Editor”).
Step 2: Define the Use Cases
For each actor, brainstorm what they want to achieve. Use the verb-noun format.
- Bad: “Login”, “System”, “Error”.
- Good: “Authenticate User”, “Manage System Settings”, “Display Error”.
Ensure each use case represents a complete goal. If a step is just a sub-task, it might belong in a different diagram or be an Include relationship.
Step 3: Draw the System Boundary
Draw a large rectangle on your canvas. This is your system boundary. Label it with the name of the application or process. This box separates internal logic from external interaction.
Step 4: Connect Actors to Use Cases
Place your actors outside the box and your use cases inside. Draw lines connecting the actors to the use cases they interact with. Ensure that:
- No use case is isolated (every oval must connect to at least one actor).
- No actor is isolated (every stick figure must have at least one interaction).
- Lines do not cross unnecessarily (keep the diagram clean).
Step 5: Refine Relationships
Review the diagram for redundancy. If multiple use cases share a common sub-step, consider using the Include relationship to clean up the diagram. If a use case has optional behaviors, use the Extend relationship. This reduces clutter and improves readability.
🚫 Common Pitfalls to Avoid
Even experienced modelers make mistakes. Being aware of common errors can save you time during the review process. Here are the most frequent issues found in Use Case Diagrams.
- Describing Implementation: Avoid technical terms like “Database Query” or “Send API Request” inside the Use Case oval. These describe how the system works, not what the user wants. Stick to business goals.
- Too Many Actors: If you have dozens of actors, you might be modeling too much. Group them into higher-level roles or focus on the primary actors for the initial diagram.
- Over-Engineering: Don’t try to model every single click or screen transition. Use Case Diagrams are high-level. Detailed flows belong in Sequence Diagrams or User Stories.
- Disconnected Use Cases: Every oval must be connected to an actor. If a use case floats alone, it is unclear who triggers it.
- Confusing Generalization: Do not use Generalization for simple variations. Only use it when one actor or use case is a specialized version of another (e.g., “Gold Member” is a “Premium User”).
📈 Integrating with Other Models
Use Case Diagrams rarely stand alone. They are part of a larger ecosystem of documentation. Understanding how they fit with other artifacts helps you communicate effectively with development teams.
Use Case vs. User Stories
User Stories are text-based descriptions of requirements (e.g., “As a user, I want to… so that…”). Use Case Diagrams provide the visual map of these stories.
- Scope: Use Cases provide a high-level overview of the system’s functional areas.
- Detail: User Stories provide the specific acceptance criteria and edge cases.
- Workflow: The diagram shows the “What”, while the stories show the “How”.
Use Case vs. Data Models
Data models (like ER Diagrams) focus on the structure of information. Use Case Diagrams focus on the behavior of the system. Both are necessary but serve different purposes.
- Data Model: Defines entities, attributes, and relationships (e.g., User, Order, Product).
- Use Case: Defines actions that manipulate those entities (e.g., Create Order, Update Product).
💡 Best Practices for Clarity
To ensure your diagram is effective, follow these guidelines for layout and naming conventions.
- Consistent Naming: Use the same terminology for actors and use cases throughout the document. If you call it “Login” in one place, don’t call it “Sign In” in another.
- Logical Grouping: If the system is large, consider splitting the diagram into subsystems. Group related use cases together visually.
- White Space: Don’t crowd the diagram. Leave space between actors and use cases to make lines easier to follow.
- Version Control: Diagrams evolve. Keep a record of changes. If a requirement changes, update the diagram and note the revision date.
- Review with Stakeholders: Show the diagram to the business users. If they can read it and say, “Yes, that is how we work,” you have succeeded. If they are confused, simplify it.
🛠️ Tools and Mediums
You do not need expensive software to create these diagrams. The goal is clarity, not fancy graphics. The choice of medium depends on your team’s workflow.
- Whiteboards: Excellent for initial brainstorming sessions. The low fidelity encourages rapid iteration and discussion.
- Pen and Paper: Good for quick sketches during meetings. Easy to erase and redraw.
- Digital Drawing Tools: Any vector graphics tool can be used. Focus on standard shapes (ovals, rectangles, stick figures).
- Documentation Platforms: Many knowledge bases allow for diagramming plugins. These ensure the diagram lives with the documentation.
Remember, the tool is secondary to the logic. A hand-drawn diagram that accurately captures the requirements is far more valuable than a polished digital diagram that is logically flawed.
🌟 Final Thoughts on Accessibility
The barrier to understanding UML Use Case Diagrams is often psychological rather than technical. Many professionals assume that because it is a formal standard, it must be difficult to learn. This is not the case.
By breaking down the notation into its core components—Actors, Use Cases, and Relationships—you strip away the complexity. The diagram is simply a map of who does what within the system. It is a communication tool, not a coding specification.
Whether you are a business analyst, a developer, or a product owner, the ability to visualize system behavior is a valuable skill. It reduces misunderstandings, aligns expectations, and saves time during the development lifecycle. You do not need an advanced degree to learn this; you just need a willingness to visualize the problem clearly.
📚 Key Takeaways
- Use Cases are about goals: Focus on what the user wants to achieve, not how the system processes it.
- Actors are roles: Think about roles, not specific people.
- Keep it simple: Avoid over-complicating relationships. Use Include and Extend only when necessary.
- Communication is key: The diagram is meant to be read by humans, not just parsed by machines.
- Iterate: Diagrams change as requirements evolve. Treat them as living documents.
With this foundation, you are equipped to create, read, and interpret Use Case Diagrams effectively. The knowledge is accessible, and the benefits to your projects are immediate. Start modeling today and bring clarity to your system design.