
Business analysis requires more than just gathering requirements; it demands a clear visualization of how a system interacts with the world around it. The Unified Modeling Language (UML) offers a standardized notation for this purpose, and among its many tools, the Use Case Diagram stands out for its simplicity and direct communication value. For a Business Analyst, understanding this diagram is not just about drawing boxes and sticks; it is about mapping the scope of a solution and ensuring all stakeholder needs are accounted for before development begins.
This guide explores the mechanics, purpose, and strategic application of Use Case Diagrams. We will break down the elements, relationships, and best practices that define effective modeling without relying on specific tools or jargon-heavy explanations.
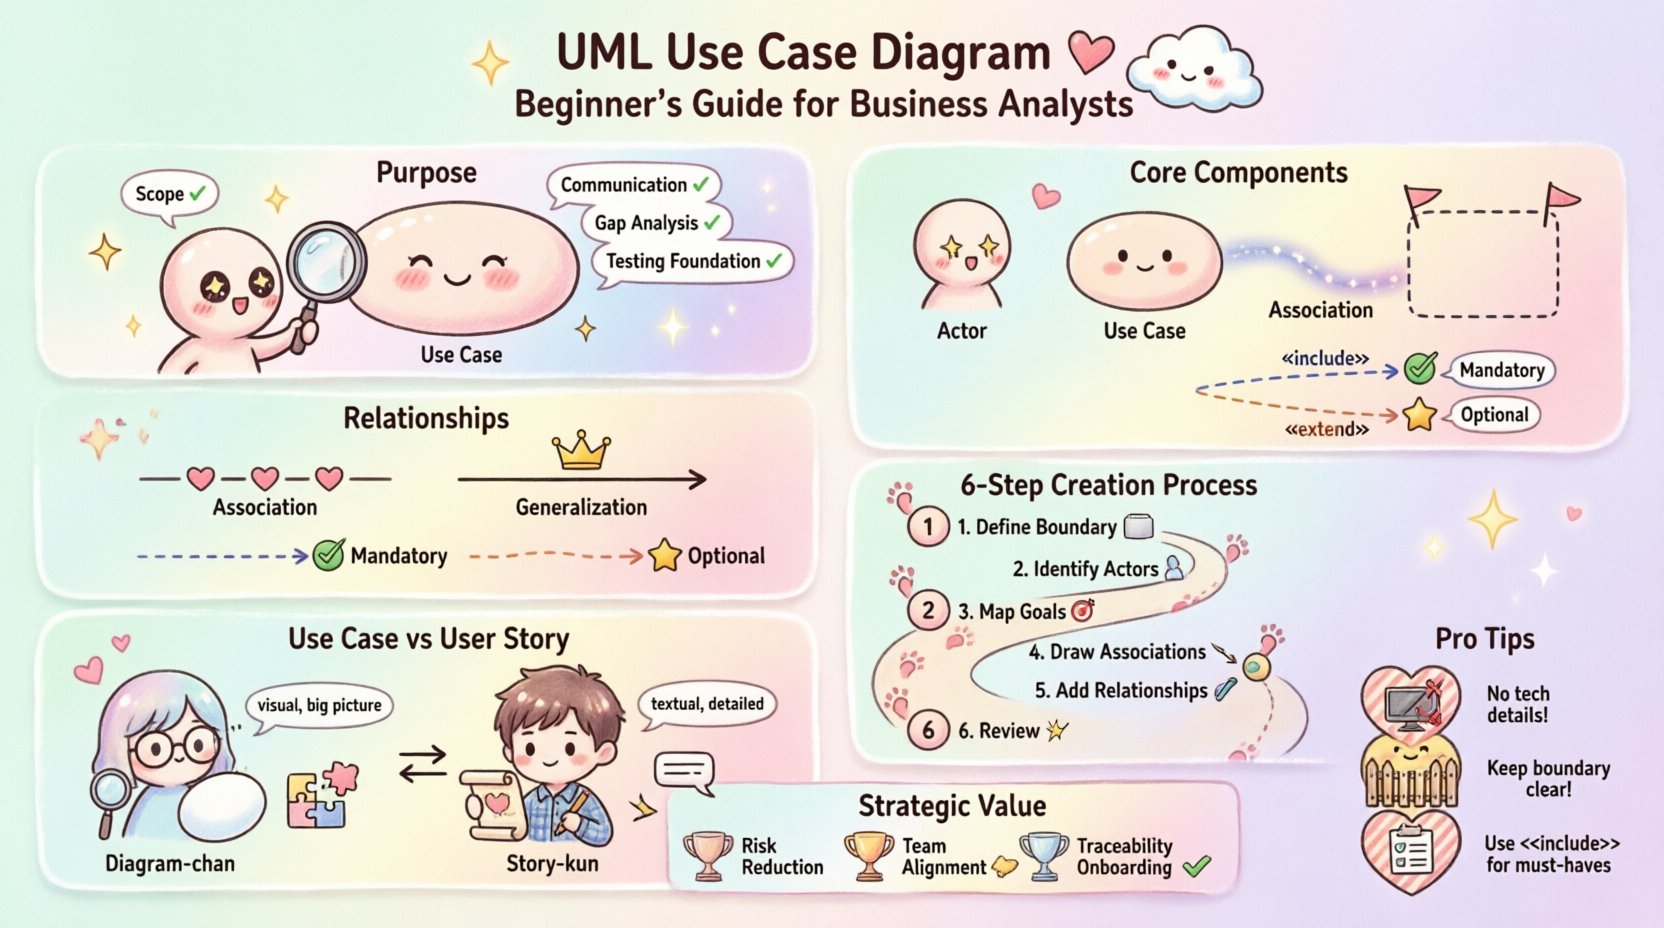
🔍 Understanding the Purpose
A Use Case Diagram serves as a high-level blueprint of system functionality. It answers the fundamental question: What can the system do for the users? Unlike sequence diagrams that focus on timing or class diagrams that focus on data structure, the Use Case Diagram focuses on behavior and interaction.
For Business Analysts, this diagram acts as a bridge between technical teams and business stakeholders. It translates abstract business goals into concrete system actions. When a stakeholder asks, “Will the system allow me to export reports?”, the diagram provides a visual confirmation of that capability.
- Scope Definition: It clearly delineates what is inside the system and what is outside.
- Communication: It provides a common language for developers, testers, and business owners.
- Gap Analysis: It helps identify missing functionalities during the early planning phases.
- Testing Foundation: Testers use these diagrams to derive test cases based on defined interactions.
🧱 Core Components Explained
Every diagram is built upon specific building blocks. Understanding these components ensures that the model remains accurate and readable. Below is a breakdown of the essential elements found in a standard UML Use Case Diagram.
| Element | Symbol | Definition |
|---|---|---|
| Actor | Stick Figure | A user or external system that interacts with the main system. |
| Use Case | Oval | A specific function or goal that the system performs for an actor. |
| System Boundary | Rectangle | A box that defines the limits of the system being modeled. |
| Association | Line | A connection showing communication between an actor and a use case. |
| Relationship | Arrow with Label | Indicates dependency, inclusion, or extension between use cases. |
Actors: Who Interacts?
An actor represents a role played by a user or an external entity. It is crucial to remember that actors are not necessarily specific people; they are roles. For example, a “Admin” actor might be filled by different individuals, but the permissions and actions remain the same.
- Human Actors: Primary users like customers, employees, or managers.
- External Systems: Other software platforms that exchange data with the current system.
- Hardware: Physical devices such as sensors or payment terminals.
Use Cases: What is the Goal?
A use case represents a complete unit of functionality. It should describe what happens, not how it happens. If a use case is too detailed, it belongs in a textual description, not a diagram.
- Primary Use Case: The main goal of the interaction.
- Secondary Use Case: Supporting actions that occur within the context of a primary goal.
🔗 Relationships and Interactions
The power of the diagram lies in how elements connect. These relationships define the flow of logic and dependencies within the system. There are three primary types of relationships to understand deeply.
1. Association (Communication)
This is the most basic link. It shows that an actor can initiate or participate in a specific use case. A solid line connects the actor to the oval representing the use case. If there is no line, there is no interaction.
2. Generalization (Inheritance)
This relationship indicates that one element is a specialized version of another. In the context of actors, it means a child actor inherits the capabilities of the parent actor.
- Actor Inheritance: A “Premium Member” actor might generalize from a “Member” actor, inheriting all standard member actions plus exclusive ones.
- Use Case Inheritance: A specific use case can generalize a more generic one, though this is less common in basic modeling.
3. Dependency (<> and <>)
These relationships manage the complexity of use cases by breaking them down into smaller, reusable pieces.
Include Relationship
An include relationship means one use case must call another to complete its function. The included use case is mandatory.
- Example: “Checkout” includes “Payment Processing”. You cannot complete the checkout without payment.
- Visual: Dashed arrow with the label
«include».
Extend Relationship
An extend relationship means one use case may add functionality to another under specific conditions. It is optional.
- Example: “Order Placement” may be extended by “Apply Discount Code”. This happens only if the user chooses to apply a code.
- Visual: Dashed arrow with the label
«extend».
🛠️ Constructing the Diagram
Creating a Use Case Diagram is a structured process. It requires collaboration and logical thinking rather than artistic skill. Follow this systematic approach to ensure accuracy.
- Define the System Boundary: Draw a rectangle that represents the scope of the software or process. Everything inside is the system; everything outside is the environment.
- Identify the Actors: List all roles that interact with the system. Ask stakeholders: “Who needs to use this system?” and “Who provides data to it?”.
- Map Primary Goals: For each actor, determine their main goal. Draw an oval for each goal inside the boundary.
- Draw Associations: Connect actors to the use cases they initiate with solid lines.
- Add Relationships: Determine if any use cases are mandatory parts of others (include) or optional additions (extend). Draw dashed arrows accordingly.
- Review for Redundancy: Ensure no two use cases do exactly the same thing. Merge them if necessary to keep the model clean.
📋 Use Case vs User Story
Business Analysts often work with both Use Cases and User Stories. While they serve similar purposes in requirement gathering, they differ significantly in structure and focus. Understanding the distinction helps in selecting the right artifact for the project phase.
| Feature | Use Case Diagram | User Story |
|---|---|---|
| Format | Visual Diagram | Textual Statement |
| Focus | System Scope and Actors | User Value and Acceptance |
| Granularity | High-level Functionality | Specific Implementation Detail |
| Usage | Early Planning & Design | Agile Development Sprints |
| Detail Level | Abstract Behavior | Acceptance Criteria Included |
When to Use Which?
- Use Case: Best for complex systems with many actors and intricate flows where the scope needs visual definition.
- User Story: Best for Agile teams focusing on incremental delivery and specific user value.
⚠️ Common Pitfalls
Even experienced analysts can make mistakes when modeling. Avoiding these common errors ensures the diagram remains a useful tool rather than a source of confusion.
- Too Many Actors: If the diagram becomes cluttered, consider grouping actors or simplifying the scope.
- Technical Details: Do not include screen names (e.g., “Login Screen”) as use cases. Use cases are actions (e.g., “Log In”).
- Confusing Actors with Systems: Ensure external systems are clearly marked. Do not confuse an external API with a human user role.
- Overusing Extend: If a relationship is mandatory, use
«include». Reserve«extend»for truly optional scenarios. - Ignoring the Boundary: Always draw the system boundary. Without it, the scope is ambiguous.
📐 Defining System Boundaries
The rectangle representing the system boundary is the most critical visual element. It separates the internal logic of the software from the external environment.
- Clarity: Anything inside the box is the responsibility of the development team.
- Responsibility: Anything outside is managed by the user, hardware, or third-party services.
- Updates: If the scope changes, the boundary must be redrawn to reflect the new limits of the project.
A well-defined boundary prevents scope creep. It forces the team to acknowledge when a request falls outside the current system’s design.
✅ Validation and Review
Once the diagram is drafted, it must be validated. A diagram that sits in a document folder provides no value. It must be reviewed to ensure it matches reality.
Steps for Validation
- Walkthrough with Stakeholders: Present the diagram to the business owners. Ask them if they recognize their roles and goals.
- Technical Feasibility Check: Ask developers if the defined use cases are technically achievable within the architecture.
- Completeness Check: Ensure every actor has at least one use case, and every use case has at least one actor.
- Consistency Check: Verify that names are consistent across the diagram and any accompanying documentation.
🌟 Integrating with Other Models
A Use Case Diagram rarely stands alone. It is part of a larger ecosystem of documentation. Integrating it with other artifacts creates a robust requirements specification.
- Use Case Descriptions: Each oval in the diagram can be expanded into a detailed text document containing preconditions, postconditions, and main flows.
- Sequence Diagrams: These can be used to detail the specific interactions within a complex use case.
- State Machine Diagrams: Useful for modeling the lifecycle of an object involved in a use case.
🎯 Strategic Value for Business Analysts
Why invest time in this modeling technique? The strategic value extends beyond the drawing itself.
- Risk Reduction: Catching missing requirements early reduces the cost of changes later in the development lifecycle.
- Alignment: It ensures developers and business stakeholders are looking at the same picture.
- Traceability: It helps trace requirements back to business goals, ensuring the project delivers actual value.
- Onboarding: New team members can understand the system architecture quickly by reviewing the diagram.
By mastering the fundamentals of Use Case Diagrams, Business Analysts can lead projects with clarity and precision. The diagram is not just a technical artifact; it is a communication tool that aligns vision with execution.
🔚 Final Thoughts
The Use Case Diagram remains a cornerstone of system analysis. Its simplicity allows it to convey complex interactions without overwhelming the audience. For Business Analysts, it is an essential skill that bridges the gap between business needs and technical implementation. By focusing on clear actors, well-defined goals, and logical relationships, you can create models that drive project success.
Remember that the diagram is a living document. As requirements evolve, the diagram should evolve with them. Keep it updated, keep it clear, and keep it aligned with the business reality.