
In the landscape of system analysis, clarity is currency. 📉 Requirements engineers often face the challenge of translating business needs into technical specifications. Two of the most common visual tools available for this task are the UML Use Case Diagram and the Flowchart. While both serve to model system behavior, they operate on fundamentally different principles. Misidentifying the purpose of each diagram can lead to scope creep, ambiguous requirements, and misaligned development efforts.
This guide provides a deep dive into the structural and functional differences between these models. We will examine how each tool communicates information, the specific contexts in which they excel, and how to leverage them without redundancy. The goal is to establish a robust framework for documentation that supports accurate system implementation.
🧩 Understanding the UML Use Case Diagram
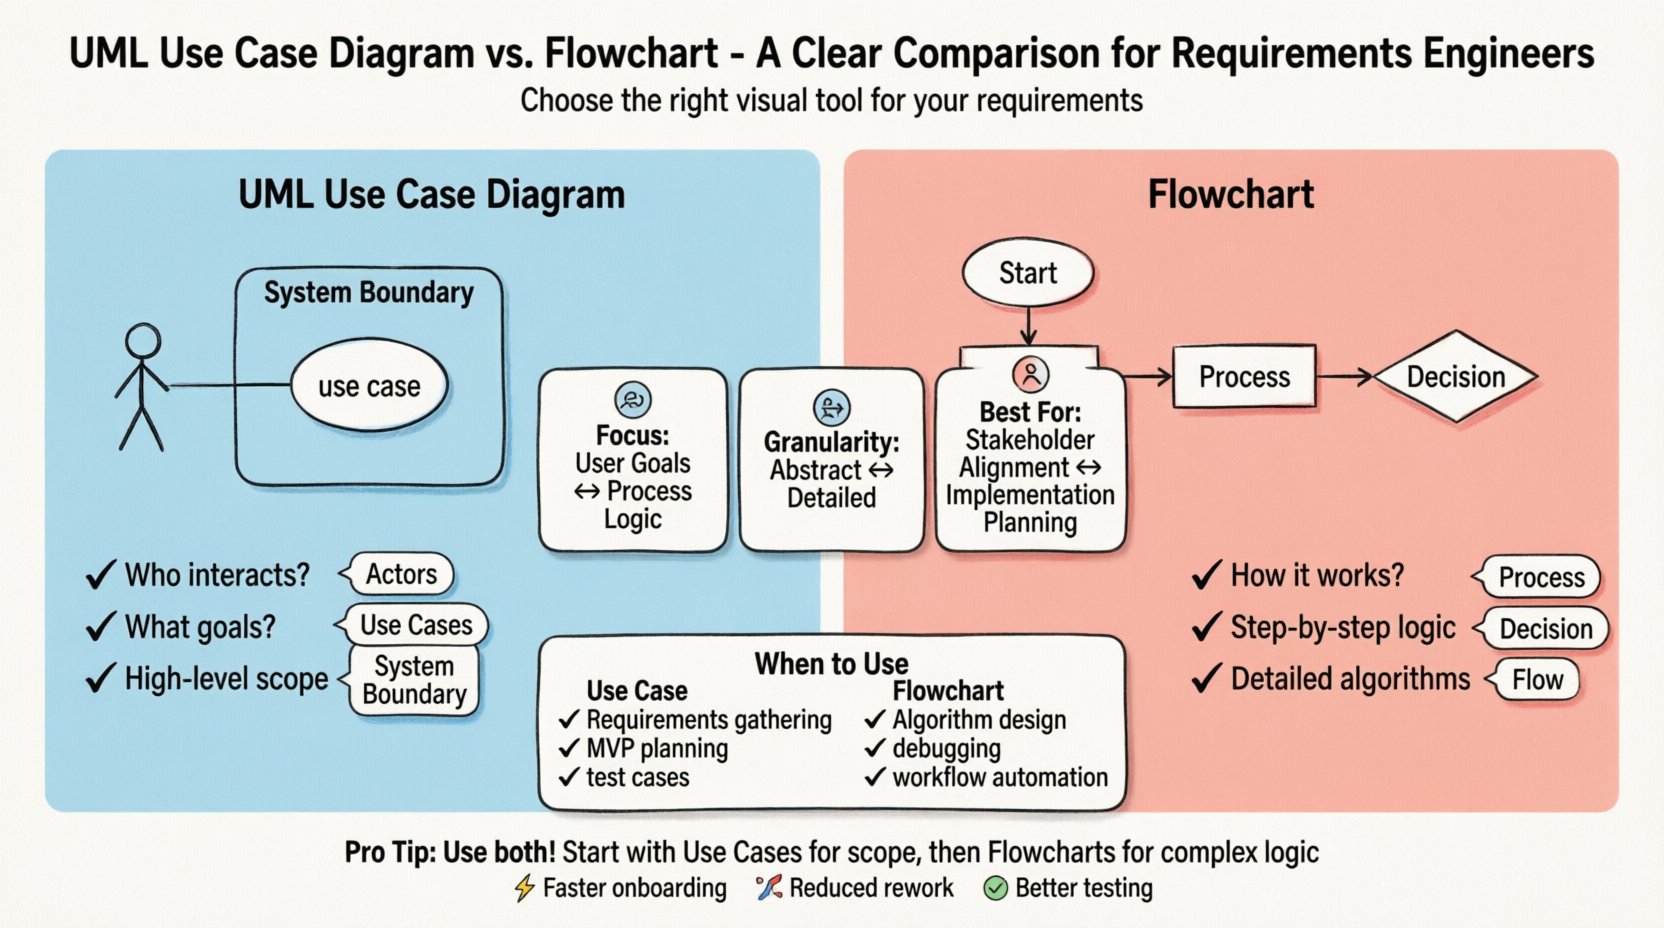
The UML Use Case Diagram is a behavioral modeling tool designed to capture the functional requirements of a system from the perspective of external actors. It answers the question: Who interacts with the system, and what goals do they achieve?
Core Components
- Actors: Represented by stick figures, these denote external entities interacting with the system. They can be human users, other systems, or hardware devices. The key is that they exist outside the system boundary.
- Use Cases: Represented by ovals, these describe a specific goal or function the system performs for an actor. A use case encapsulates a complete unit of value.
- System Boundary: A box that defines the scope of the system. Everything inside is the system; everything outside is the environment.
- Relationships: Lines connecting actors to use cases indicate interaction. Other relationships include:
- Association: Basic interaction between an actor and a use case.
- Include: Indicates that one use case inherently incorporates the behavior of another. This is used for reusable functionality.
- Extend: Indicates optional behavior that occurs under specific conditions. It allows for exception handling or optional features.
- Generalization: Shows inheritance relationships, such as a specific type of user inheriting the capabilities of a general user type.
Strategic Utility
Use Case Diagrams are ideal for high-level stakeholder communication. They abstract away the internal logic and focus on the what rather than the how. This makes them excellent for:
- Validating system scope with business stakeholders.
- Identifying missing actors or functions early in the design phase.
- Defining the boundaries of the software product.
- Creating a checklist for acceptance testing based on user goals.
📊 Understanding the Flowchart
A Flowchart is a diagrammatic representation of an algorithm, workflow, or process. It focuses on the sequence of steps and the decision logic required to reach a specific outcome. It answers the question: How does the system process data to achieve a result?
Core Components
- Terminator: Oval shapes representing the start or end of a process.
- Process: Rectangular shapes indicating an action or operation performed by the system.
- Decision: Diamond shapes representing a branching point where a condition is evaluated (e.g., Yes/No).
- Input/Output: Parallelograms for data entry or display.
- Flow Lines: Arrows indicating the direction of the process flow.
Strategic Utility
Flowcharts excel in detailing the logical flow within a specific function. They are essential for:
- Documenting complex business rules or calculation logic.
- Planning error handling and exception paths in detail.
- Assisting developers in writing conditional code.
- Visualizing data transformation steps.
⚖️ Comparative Analysis
While both diagrams map out system behavior, their granularity and intent differ significantly. The table below outlines the structural distinctions.
| Feature | UML Use Case Diagram | Flowchart |
|---|---|---|
| Primary Focus | Functional requirements and user goals | Process logic and data flow |
| Granularity | High-level, abstract | Low-level, detailed |
| Actor Perspective | Central (Who is involved?) | Peripheral (System logic first) |
| Logic Representation | Implicit (via Include/Extend) | Explicit (via Decision diamonds) |
| Best For | Scope definition and stakeholder alignment | Implementation planning and algorithm design |
| Complexity Handling | Manages many actors and features | Manages sequential steps and conditions |
🚦 When to Use Each Model
Selecting the right modeling tool depends on the phase of the requirements engineering process and the audience involved.
Scenarios Favoring Use Case Diagrams
- Initial Requirements Gathering: When defining the scope of a new product, a use case diagram helps ensure all user types are considered.
- Feature Prioritization: By listing use cases, teams can prioritize which goals are critical for the Minimum Viable Product (MVP).
- System Boundaries: When an integration project involves multiple systems, use cases clarify which system owns which responsibility.
- Test Case Generation: Testers can derive functional test cases directly from the defined use cases to verify system behavior.
Scenarios Favoring Flowcharts
- Algorithm Design: When the system involves complex calculations or data manipulation, a flowchart clarifies the steps.
- Workflow Automation: For business processes that involve approval chains or state changes, flowcharts map the lifecycle of a transaction.
- Debugging and Troubleshooting: If a system fails, a flowchart helps trace the path of execution to identify where the logic deviates.
- Legacy System Migration: Understanding existing logic often requires reverse-engineering the flow of operations.
⚠️ Common Pitfalls in Modeling
Even experienced engineers can fall into traps that reduce the value of these diagrams. Awareness of these pitfalls ensures higher quality requirements.
Pitfalls in Use Case Diagrams
- Over-detailing: Using a use case diagram to describe internal logic rather than user goals. If a use case describes a specific database query, it is too detailed.
- Actor Confusion: Treating internal system modules as actors. Actors must be external to the system boundary.
- Missing Relationships: Failing to use
IncludeorExtendrelationships, resulting in a flat list of functions that ignores shared or optional behaviors. - Scope Creep: Adding features to the diagram that do not align with the core business value proposition.
Pitfalls in Flowcharts
- Spaghetti Logic: Creating a diagram with too many crossing lines and loops, making it unreadable. This often happens when trying to model a whole system in one chart.
- Ignoring Edge Cases: Focusing only on the “Happy Path” and neglecting error handling or user cancellation scenarios.
- Abstraction Mismatch: Mixing high-level business steps with low-level technical operations in the same flow.
- Static Representation: Failing to account for asynchronous processes or parallel tasks, which flowcharts struggle to represent clearly.
🔗 Integrating Both Models
Using these diagrams in isolation is less effective than integrating them into a cohesive documentation suite. A robust requirements specification often utilizes both to cover different dimensions of the system.
The Layered Approach
- Strategic Layer (Use Case): Begin with the Use Case Diagram to establish the system boundary and user interactions. This sets the stage.
- Operational Layer (Flowchart): For critical or complex use cases identified in the first layer, create detailed flowcharts. This ensures the logic behind the goal is understood.
- Validation Layer: Use the Use Case Diagram to verify that all required user goals are met. Use the Flowchart to verify that the logic handles all conditions correctly.
Mapping Use Cases to Flows
It is often helpful to link specific Use Cases to their corresponding Flowcharts. This creates a traceability matrix. For example:
- Use Case: “Process Payment”
- Linked Flowchart: “Payment Processing Logic”
This linkage prevents the common issue where the high-level requirement exists, but the detailed implementation logic is undocumented. It also aids in maintenance. If the payment logic changes, the engineer knows exactly which use case is impacted.
🛠 Best Practices for Clarity
To maximize the utility of these diagrams, adhere to the following standards.
- Consistent Naming: Use action-oriented verbs for Use Cases (e.g., “Generate Report”) and descriptive nouns for Flowchart steps (e.g., “Validate User Input”).
- Visual Hierarchy: Use size and color sparingly to group related elements. Do not rely on color to convey meaning if the document will be printed in black and white.
- Version Control: Treat diagrams as living documents. Maintain version numbers and change logs to track evolution.
- Review Cycles: Conduct formal reviews with both business stakeholders and technical developers. Stakeholders validate the Use Cases; Developers validate the Flowcharts.
- Tool Agnostic Standards: Define symbol standards that apply regardless of the software used to create the diagram. This ensures longevity and portability.
🔄 Evolution and Maintenance
Requirements are not static. As the system evolves, so must the diagrams. Neglecting updates leads to “documentation rot,” where the visual model no longer reflects reality.
Change Management
When a requirement changes:
- Impact Analysis: Determine if the change affects the system boundary (Use Case) or the internal logic (Flowchart).
- Propagation: Update the diagram first, then update the associated text specifications. The visual model is often the source of truth for the logic.
- Communication: Notify the development team immediately upon diagram updates. A change in a flowchart often implies a change in code structure.
Avoiding Redundancy
Do not document the same logic in both diagrams. If a flowchart is included, the use case should not describe the steps of that flowchart. The use case should describe the outcome. This separation of concerns reduces cognitive load for the reader.
📈 Impact on Development Efficiency
Investing time in accurate modeling pays dividends during the development phase. Ambiguous requirements are the leading cause of project delays and budget overruns. Clear diagrams mitigate this risk.
- Reduced Rework: Developers spend less time guessing the intent of a requirement.
- Faster Onboarding: New team members can understand the system architecture faster through clear diagrams.
- Improved Testing: QA engineers can create comprehensive test suites based on the defined paths and exceptions.
- Better Estimation: Accurate flowcharts allow for more precise effort estimation during the sprint planning phase.
🧭 Final Considerations for Engineers
The choice between a UML Use Case Diagram and a Flowchart is not a binary decision but a contextual one. The most effective requirements engineers know when to zoom out and look at the actors, and when to zoom in and look at the logic. By understanding the strengths and limitations of each, you can construct a documentation framework that supports the entire software development lifecycle.
Focus on the audience. If the reader is a business owner, lean towards the Use Case Diagram. If the reader is a software architect, lean towards the Flowchart. When in doubt, use both, but clearly distinguish their purpose. This discipline ensures that the requirements remain clear, actionable, and aligned with the business value throughout the project lifecycle.