
When starting out with software architecture, few concepts generate as much confusion as the Unified Modeling Language (UML). Among the many diagram types available, the Use Case Diagram often stands out as both the most intuitive and the most misunderstood. Beginners frequently stumble over the definitions, the actors, and the actual purpose of these visual models.
There is a lot of noise online regarding system modeling. Some sources suggest these diagrams are only for high-level executives, while others claim they are the final step in coding. Both statements miss the mark. The truth lies in the middle: these diagrams are essential communication tools that bridge the gap between business requirements and technical implementation.
This guide cuts through the confusion. We will examine common misconceptions, clarify the core mechanics, and provide a practical framework for creating effective models. By the end of this article, you will understand not just how to draw a diagram, but why it matters.
📐 What Exactly Is a Use Case Diagram?
At its core, a Use Case Diagram is a behavioral diagram. It describes the interaction between external entities and the system itself. It answers the fundamental question: Who uses the system, and what can they do with it?
Unlike a flowchart that shows the step-by-step logic of a process, or a class diagram that shows the internal structure of data, the Use Case Diagram focuses on functionality from the user’s perspective. It captures the system’s requirements without getting bogged down in implementation details.
Key components include:
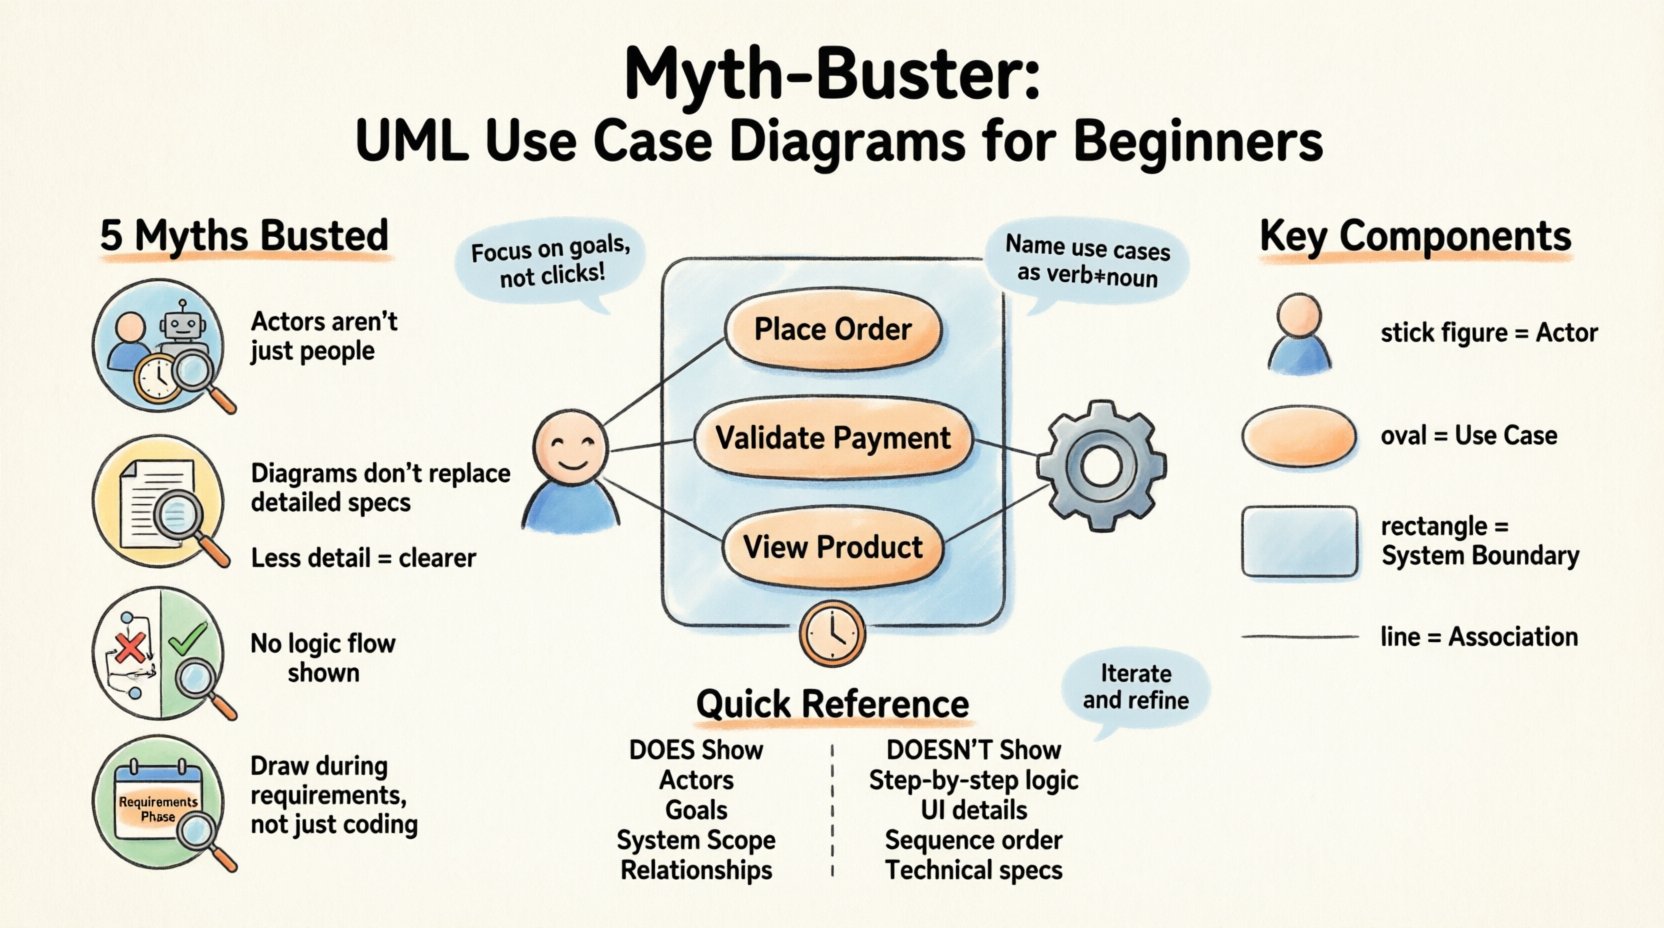
- Actors: The external entities initiating the interaction. These are represented as stick figures.
- Use Cases: The specific goals or tasks the actor can achieve. These are represented as ovals.
- System Boundary: A rectangle that defines the scope of the system being modeled.
- Associations: The lines connecting actors to use cases, indicating a relationship.
Understanding these building blocks is the first step. However, knowing the parts is not enough. You must understand the common pitfalls that derail the modeling process.
🚫 Myth #1: Actors Must Always Be Human Beings
This is perhaps the most persistent misconception among novices. When people hear the word “actor,” they immediately visualize a person sitting at a keyboard. While human users are indeed the most common type of actor, they are not the only option.
In the context of system modeling, an actor is simply an external entity that interacts with the system. This entity can be:
- A Human User: Such as an administrator, customer, or guest.
- A Hardware Device: Such as a sensor, printer, or payment terminal.
- A Software System: Another application or database that communicates with your system via an API.
- A Time Trigger: A specific time-based event that initiates a process, often represented as a timer actor.
Why this distinction matters: If you restrict your actors to only humans, your model becomes incomplete. For instance, in an automated billing system, the “Credit Card Processor” is an external system. If you do not model this system as an actor, you might overlook critical integration points, error handling for failed transactions, or security protocols required for that external connection.
Always ask yourself: “Is there anything outside the system boundary that triggers an action or receives data?” If the answer is yes, it deserves to be an actor.
🚫 Myth #2: They Replace Detailed Requirements Documents
Some teams treat the Use Case Diagram as a substitute for a full requirements specification. They draw the diagram and assume everyone understands the details. This approach is dangerous and often leads to scope creep and development errors.
A Use Case Diagram provides a high-level overview. It shows what happens, but rarely how it happens. It does not capture:
- Specific input validation rules.
- Error handling logic.
- Performance constraints.
- Data storage structures.
Think of the diagram as a table of contents for your system. It lists the chapters (use cases), but it does not write the story inside them.
Best Practice: For every use case in your diagram, you should ideally have a corresponding Use Case Description or Narrative. This text document details the preconditions, the main success scenario, and alternative paths. The diagram tells stakeholders the scope; the description defines the logic.
🚫 Myth #3: More Detail Equals Better Modeling
Beginners often feel the urge to be exhaustive. They want to include every single button click and every minor system action as a separate use case. This results in a diagram that is cluttered, confusing, and useless.
The Rule of Granularity: A use case should represent a discrete unit of functionality that delivers value to an actor. If an action is too small, it belongs inside a use case, not as a use case itself.
Consider the difference between these two statements:
- Bad: “Click Submit Button”
- Good: “Place Order”
“Click Submit Button” is a UI interaction. “Place Order” is a goal. The goal includes the button click, the validation, the database write, and the confirmation screen. By focusing on goals rather than UI actions, the diagram remains stable even if the interface changes.
If your diagram looks like a spiderweb with hundreds of lines, you have likely over-modeled. You should be able to explain the system’s purpose to a stakeholder in five minutes using the diagram. If it takes an hour, it is too complex.
🚫 Myth #4: These Diagrams Show System Logic Flow
There is a common confusion between the Use Case Diagram and the Activity Diagram or Sequence Diagram. Beginners often expect the Use Case Diagram to show the order of operations. It does not.
Use Case Diagrams show relationships between actors and functions, not the chronological sequence of events within a function. They do not show:
- Which use case happens first.
- The decision points inside a process.
- The iteration loops.
If you need to visualize the flow of data or the sequence of steps, you must use an Activity Diagram or a Sequence Diagram. The Use Case Diagram is static. It is a map of capabilities, not a map of movement.
Visualizing the Difference: | Diagram Type | Focus | Shows Logic? | Shows Flow? | | :— | :— | :— | :— | | Use Case | Functionality & Actors | No | No | | Activity | Workflow & Process | Yes | Yes | | Sequence | Object Interaction | Yes | Yes |
Keeping these distinctions clear prevents you from trying to force a square peg into a round hole.
🚫 Myth #5: You Only Draw Them During Development
Many teams wait until the coding phase to create diagrams. They believe diagrams are just for documentation after the work is done. This is a reactive approach that misses the strategic value of modeling.
Use Case Diagrams are most valuable during the requirements gathering and design phases. They help identify gaps before a single line of code is written.
- During Planning: Helps define the scope of the MVP (Minimum Viable Product).
- During Design: Helps architects understand integration points between services.
- During Testing: QA teams use them to ensure all defined use cases have test coverage.
Creating these diagrams early allows stakeholders to visualize the system and correct misunderstandings before they become expensive code changes. Waiting until the end often means the model is already out of date.
🔗 Understanding Relationships
Once you have your actors and use cases, you need to define how they interact. There are three primary relationship types in UML that define the structure of your model.
1. Association
This is the standard line connecting an actor to a use case. It indicates that the actor participates in that use case. It implies a direct relationship without inheritance or dependency logic.
2. Include (<>)
This relationship indicates that one use case must involve another use case to complete its task. It represents mandatory behavior.
- Example: The “Place Order” use case includes “Validate Payment”.
- Why use it: It reduces repetition. If “Validate Payment” is needed in “Place Order”, “Refund Order”, and “Cancel Order”, you define the logic once and include it everywhere.
3. Extend (<>)
This relationship indicates that one use case may involve another under specific conditions. It represents optional behavior.
- Example: The “View Product” use case can be extended by “Show Recommendation”.
- Why use it: It allows you to model variations without cluttering the main flow. The extension only happens if a specific condition is met (e.g., the user has a loyalty card).
4. Generalization
This is inheritance. A specific actor or use case inherits the behavior of a general one.
- Actor Generalization: “Premium User” is a type of “User”. They inherit all the capabilities of a standard User but may have additional ones.
- Use Case Generalization: “Pay Online” is a specific type of “Make Payment”.
🛠️ When to Use and When to Avoid
While powerful, this modeling technique is not a silver bullet for every situation. Knowing when to apply it is as important as knowing how to draw it.
✅ When to Use
- Complex Systems: When a system has many different user roles, a diagram helps organize the complexity.
- Scope Definition: When you need to agree on what is in and out of scope with a client.
- Integration Projects: When multiple systems need to talk to each other, showing the external actors clarifies the boundaries.
- Onboarding: When bringing new developers onto a project, a diagram provides a quick overview of system capabilities.
❌ When to Avoid
- Simple Scripts: If you are writing a simple script that runs once, a diagram is overkill.
- Algorithmic Logic: If the focus is purely on mathematical calculation or data transformation without user interaction, other diagrams are better.
- UI Design: Do not use this to design buttons or layout. Wireframes are better for that.
📋 Best Practices for Clarity
To ensure your diagrams are effective, follow these guidelines.
- Keep it Readable: Avoid crossing lines where possible. If the diagram becomes a tangled mess, split it into sub-systems.
- Use Meaningful Names: Use verb-noun pairs for use cases (e.g., “Process Return” instead of “Return”). Name actors by role, not by person (e.g., “Cashier” not “John”).
- Respect the Boundary: Everything inside the box belongs to the system. Everything outside is an actor or external dependency. Do not place internal logic inside the box.
- Iterate: Your first draft will not be perfect. Refine the diagram as you learn more about the requirements.
- Focus on Goals: Always step back and ask: “Does this use case achieve a goal for the actor?” If not, remove it.
🔍 Common Pitfalls to Watch For
Even experienced modelers make mistakes. Here are the most frequent errors to watch out for.
- Missing Actors: Forgetting external systems or time triggers.
- Confusing Use Cases with UI Screens: Don’t name a use case “Login Screen”. Name it “Authenticate User”. The screen might change, but the goal remains.
- Overusing Include/Extend: If you have ten include relationships, your logic is likely too distributed. Simplify the model.
- Ignoring Non-Functional Requirements: Use Case Diagrams focus on function. They do not show security, performance, or reliability. Do not assume the diagram covers everything.
- Static Assumptions: Systems evolve. A diagram from last year may not reflect current features. Keep it updated.
🧩 Integrating with Other Models
A Use Case Diagram rarely stands alone. It is part of a larger ecosystem of diagrams.
- Class Diagrams: Once you know what the system does (Use Case), you design what the system is (Class Diagram).
- Activity Diagrams: Once you know the function, you map the workflow (Activity Diagram).
- Sequence Diagrams: Once you know the actors and steps, you map the object interaction (Sequence Diagram).
Think of the Use Case Diagram as the index. It tells you where to look for more details in the other documents.
💡 Final Thoughts on Modeling
Modeling is a discipline of abstraction. It is the art of simplifying complexity without losing essential meaning. The Use Case Diagram is one of the most powerful tools in your arsenal for achieving this balance.
By debunking the myths surrounding actors, granularity, and purpose, you can move from drawing shapes to designing solutions. You create a shared language between business stakeholders and technical teams. This alignment reduces risk, saves time, and ensures the final product meets the actual needs of the users.
Remember, the goal is not to produce a perfect diagram for the sake of perfection. The goal is to produce a diagram that facilitates understanding. If your team looks at the diagram and agrees on what the system should do, you have succeeded. If it confuses them, you need to simplify.
Start small. Focus on the main actors. Identify the core goals. Build the model incrementally. As you gain experience, you will find the right balance between detail and abstraction. This approach will serve you well throughout your career in system design and software architecture.