
Modeling business processes is a critical step in software development and system architecture. It ensures that all stakeholders share a clear understanding of how a system functions before a single line of code is written. Among the Unified Modeling Language (UML) standards, two diagrams stand out for their utility in business contexts: the Use Case Diagram and the Activity Diagram. While both serve to visualize system behavior, they operate at different levels of abstraction and address distinct questions. This guide provides a detailed examination of their differences, strengths, and ideal applications for business process modeling.
📊 Understanding UML Use Case Diagrams
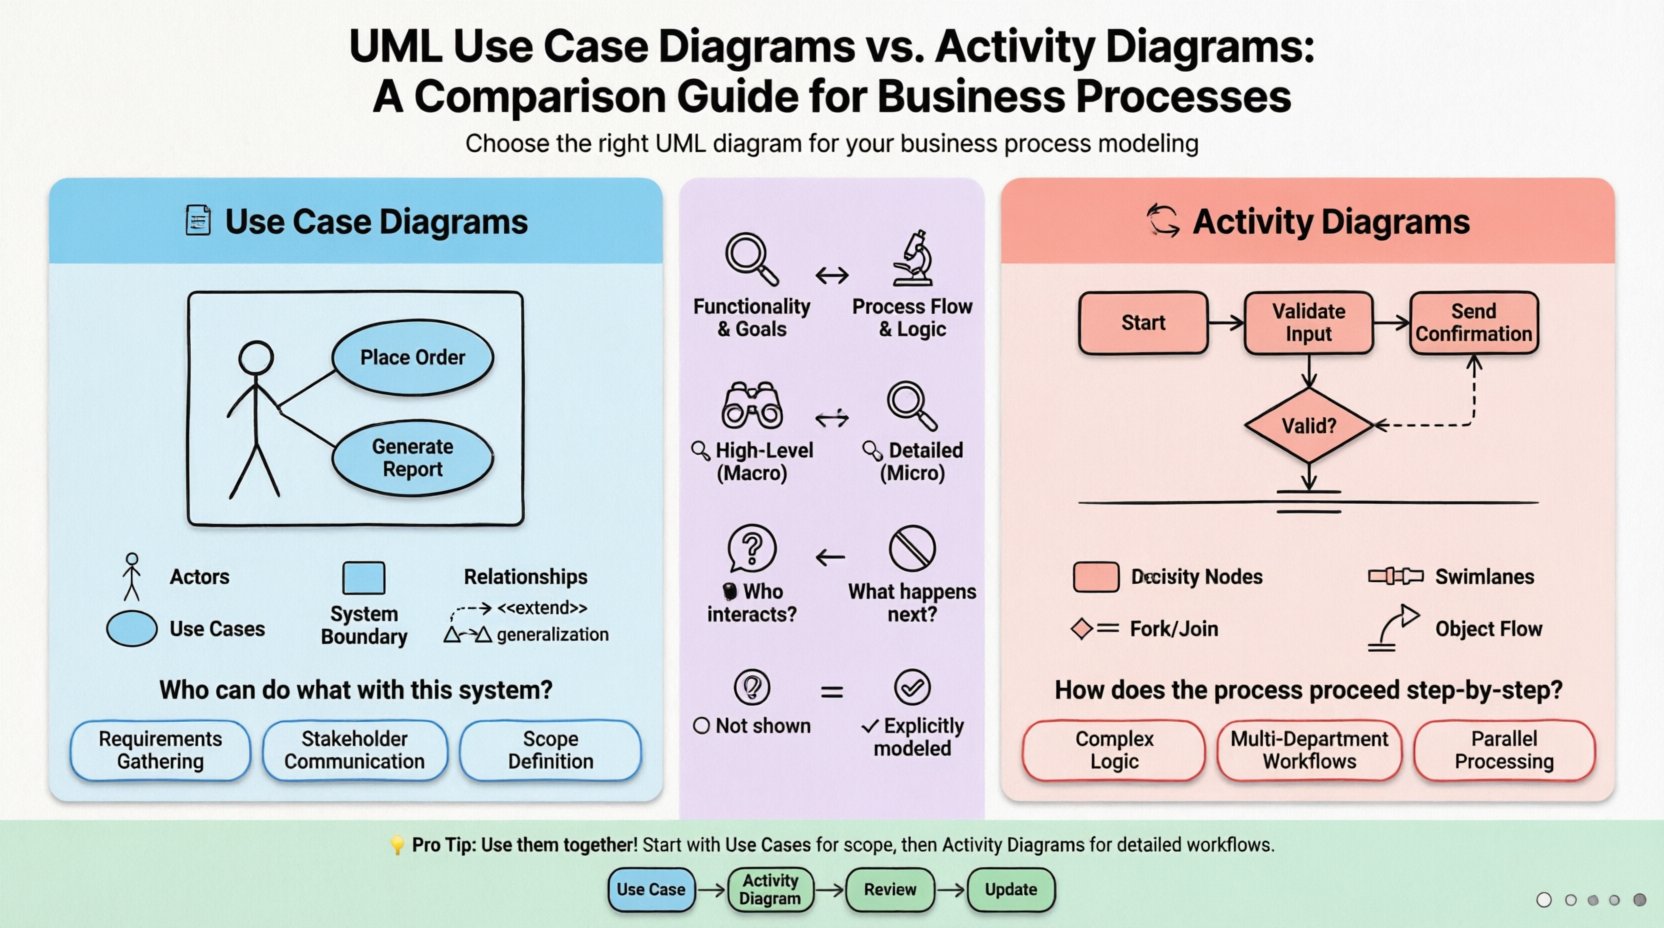
The Use Case Diagram is designed to capture the functional requirements of a system from the perspective of external entities. It focuses on what the system does, rather than how it does it. This high-level view is essential for communicating with business stakeholders who may not have technical expertise.
Core Components
- Actors: Represented by stick figures, actors denote roles played by users or external systems. An actor is defined by their interactions, not their identity. For example, a “Customer” actor can interact with the system regardless of whether it is a specific person named John or Jane.
- Use Cases: Depicted as ovals, these represent specific functionalities or goals. A use case describes a complete unit of work. Examples include “Place Order,” “Generate Report,” or “Process Refund.”
- System Boundary: A box enclosing the use cases defines the scope of the system. Actors exist outside this boundary, interacting with the system through the boundary line.
- Associations: Lines connecting actors to use cases indicate interaction. These lines show that the actor initiates or participates in that specific functionality.
- Relationships: Advanced modeling includes three specific relationship types:
- Include: Indicates that one use case necessarily incorporates another. For instance, “Place Order” includes “Validate Payment”.
- Extend: Indicates optional behavior. A “Place Order” use case might be extended by “Apply Discount” if the user is a VIP member.
- Generalization: Allows for inheritance. A “Premium Customer” actor can generalize from a “Customer” actor, inheriting all standard interactions while potentially having additional ones.
Primary Purpose
The primary goal of a Use Case Diagram is requirements gathering and scope definition. It answers the question: “Who can do what with this system?” It is the foundational document for functional specifications. By mapping out actors and their goals, teams can identify missing requirements or unnecessary complexity early in the design phase.
🔄 Understanding Activity Diagrams
While Use Case Diagrams focus on interactions, the Activity Diagram focuses on the flow of control and data. It is the UML equivalent of a flowchart but with more rigorous notation. This diagram is ideal for detailing the logic behind a specific use case or a complex business process.
Core Components
- Activity Nodes: Rounded rectangles representing specific actions or operations within the process. These can range from simple checks to complex data transformations.
- Control Flow: Directed arrows showing the sequence of activities. The path taken depends on the completion of the previous step.
- Decision Nodes: Diamond shapes that represent a point where the flow branches. A condition determines which path is taken next (e.g., “Is Credit Available?” leads to Yes or No).
- Fork and Join Nodes: Thick black bars used to manage concurrency. A fork splits a single flow into multiple simultaneous paths, while a join merges them back together.
- Swimlanes: Horizontal or vertical partitions that organize activities by responsibility. This is crucial for business processes involving multiple departments or roles. It clarifies who is responsible for each step.
- Object Flow: Arrows representing the movement of data or objects between activities, rather than just control.
Primary Purpose
Activity Diagrams are used for algorithmic logic and workflow analysis. They answer the question: “How does the process proceed step-by-step?” They are particularly valuable for understanding complex conditional logic, parallel processing, and state transitions within a specific workflow.
🔍 Core Differences Breakdown
Choosing the right diagram depends entirely on the specific problem being solved. The table below outlines the structural and functional distinctions between the two.
| Feature | Use Case Diagram | Activity Diagram |
|---|---|---|
| Focus | System functionality and user goals | Process flow and logic |
| Granularity | High-level (Macro) | Detailed (Micro) |
| Key Question | Who interacts with the system? | What happens next? |
| Primary Actors | External Users, Systems | Process Steps, Data Objects |
| Concurrency | Not typically shown | Explicitly modeled via Fork/Join |
| Best For | Requirement Specification | Business Logic & Workflow |
🛠 When to Choose Use Case Diagrams
Use Case Diagrams are the starting point for most system analysis projects. They are best utilized in the following scenarios:
- Defining System Boundaries: When onboarding new team members, this diagram provides a quick overview of what is inside the system and what is outside.
- Stakeholder Communication: Business owners and clients prefer this visual style because it resembles a list of features rather than a technical flowchart.
- Identifying Missing Actors: By mapping interactions, you may discover that a specific department (e.g., “Audit Team”) needs access to the system, which was previously overlooked.
- Scope Management: It helps prevent scope creep. If a feature cannot be mapped to a specific actor-use case relationship, it may be out of scope.
- Test Case Generation: Each use case can be traced back to a set of test scenarios, ensuring functional coverage.
🛠 When to Choose Activity Diagrams
Once the high-level requirements are set, the Activity Diagram takes over to define the mechanics. Use this diagram when:
- Complex Logic Exists: If a process involves nested conditions, loops, or multiple decision points, a list of requirements is insufficient. An Activity Diagram visualizes the branching paths.
- Multi-Department Workflows: When a process involves hand-offs between different teams (e.g., Sales to Finance to Shipping), swimlanes clarify ownership at each stage.
- Parallel Processing: If a system must perform two actions simultaneously (e.g., sending an email and updating a database), activity diagrams show this concurrency clearly.
- Data Manipulation: If the focus is on how data transforms as it moves through the system (e.g., Input -> Validation -> Storage -> Notification), object flows in activity diagrams are superior.
- Algorithm Design: For backend engineers defining the logic of a specific service, activity diagrams act as pseudocode that is easier to read for non-coders.
⚠️ Common Modeling Pitfalls
Even experienced modelers can make mistakes that reduce the clarity of their diagrams. Avoid these common errors to maintain high-quality documentation.
Pitfall 1: Mixing Concerns
Do not try to force a Use Case Diagram to show detailed logic. If you find yourself adding decision diamonds inside a use case oval, you have moved into Activity Diagram territory. Keep Use Case Diagrams clean and focused on interactions. Conversely, do not use Activity Diagrams to show a list of users; that is the domain of Use Cases.
Pitfall 2: Excessive Detail
One of the most frequent issues is over-complicating the diagram. An Activity Diagram with hundreds of nodes becomes unreadable. Break complex processes down into sub-activities. Use a high-level Activity Diagram for the overall process and detailed Activity Diagrams for specific, complex sub-processes.
Pitfall 3: Ignoring Swimlanes
In business processes, ambiguity regarding responsibility is costly. If an Activity Diagram does not use swimlanes, it is unclear which department or role performs a specific step. Always define swimlanes based on organizational structure or functional areas.
Pitfall 4: Static Actors
In Use Case Diagrams, actors should represent roles, not specific individuals. Naming an actor “John Smith” is incorrect. Naming it “Sales Representative” is correct. This ensures the model remains valid even if personnel changes.
✅ Best Practices for Clarity
To ensure your diagrams are effective communication tools, adhere to these structural guidelines.
- Consistent Naming Conventions: Use action-verb nouns for Use Cases (e.g., “Update Inventory” not “Inventory Update”). Use gerunds or imperative verbs for Activity Nodes (e.g., “Calculating Tax” or “Calculate Tax”).
- Logical Grouping: Group related use cases or activities visually. In Activity Diagrams, ensure swimlanes are ordered logically from left to right or top to bottom.
- Minimal Connections: Avoid crossing lines where possible. If lines must cross, use an explicit junction node to indicate a connection rather than a mere intersection.
- Entry and Exit Points: Every diagram should have a clear start node (filled circle) and end node (double circle). This defines the lifecycle of the process.
- Version Control: Treat diagrams as living documents. Update them when business rules change. A diagram that does not reflect current processes is worse than no diagram at all.
🌐 Integration in Business Process Modeling
Effective system design often requires using both diagrams in tandem. They are not mutually exclusive; they are complementary. A typical modeling workflow might look like this:
- High-Level Scope: Create a Use Case Diagram to define the entire system boundary and major actors.
- Requirement Drill-Down: Select a complex use case (e.g., “Process Loan Application”).
- Process Detail: Create an Activity Diagram to detail the steps involved in that specific use case.
- Review: Ensure the Activity Diagram aligns with the intent of the Use Case. If the Activity Diagram reveals a step that wasn’t in the Use Case, update the Use Case.
This iterative approach ensures that high-level goals are supported by detailed execution plans. It bridges the gap between business requirements and technical implementation. For instance, a Use Case Diagram tells the developer that a “Refund” feature exists. The Activity Diagram tells them exactly how the money moves, when the inventory is restored, and who approves the transaction.
📝 Real-World Application Examples
To illustrate the distinction, consider a generic Online Retail System.
Use Case Scenario
The diagram shows three actors: “Guest,” “Registered User,” and “Administrator.” The “Registered User” can “View Products,” “Add to Cart,” and “Checkout.” The “Administrator” can “Manage Inventory.” This provides a quick map of user capabilities.
Activity Scenario
For the “Checkout” use case, the Activity Diagram details the flow. It starts with “User selects items.” It branches into “Guest Checkout” or “Logged In Checkout.” If “Logged In,” it checks for address history. Then, it enters a parallel flow: “Calculate Total” and “Apply Discount.” Finally, it joins at “Confirm Payment.” This level of detail is invisible in the Use Case Diagram but critical for the developer.
🚀 Summary of Selection Criteria
Selecting between these two modeling techniques is a strategic decision based on the audience and the goal. If the goal is to define the scope and talk to business leaders, the Use Case Diagram is the superior tool. It abstracts away the complexity of implementation and focuses on value delivery. If the goal is to define the logic and talk to developers or operations teams, the Activity Diagram is necessary. It exposes the mechanics of the system.
By understanding the unique strengths of each, architects and analysts can create documentation that is both comprehensive and accessible. The Use Case Diagram sets the stage, and the Activity Diagram directs the play. Together, they form a robust foundation for business process modeling.
Remember that clarity is the ultimate metric of success in documentation. Whether using ovals for functions or diamonds for decisions, the primary objective is to reduce ambiguity. Ensure that every line, node, and actor serves a purpose. When diagrams are clear, the resulting system is more likely to meet business needs effectively.
Adopting these practices leads to better alignment between technical teams and business units. It reduces the risk of misinterpretation during the development lifecycle. Ultimately, the choice of diagram is a choice of communication style. Match the style to the audience, and your modeling efforts will yield tangible value.