
Understanding how different components of a software system interact is fundamental to robust engineering. While code executes logic, design documents communicate intent. Among the many tools available for visualizing system behavior, the Unified Modeling Language (UML) sequence diagram stands out as a critical asset. This guide provides a detailed exploration of sequence diagrams, focusing on their structure, notation, and application in software design.
🧩 What Is a UML Sequence Diagram?
A sequence diagram is a type of interaction diagram. It shows how objects interact with each other over a specific period of time. The horizontal axis represents the different participants or objects in the system, while the vertical axis represents the passage of time. This visual layout allows developers and stakeholders to trace the flow of messages and understand the lifecycle of interactions.
Unlike static structure diagrams that show class relationships, sequence diagrams focus on dynamic behavior. They answer questions such as:
- Which object initiates a request?
- How does the system respond to that request?
- Are there conditional paths within the interaction?
- How long does an object remain active during a process?
By mapping these interactions, teams can identify potential bottlenecks, race conditions, or logical errors before writing a single line of code.
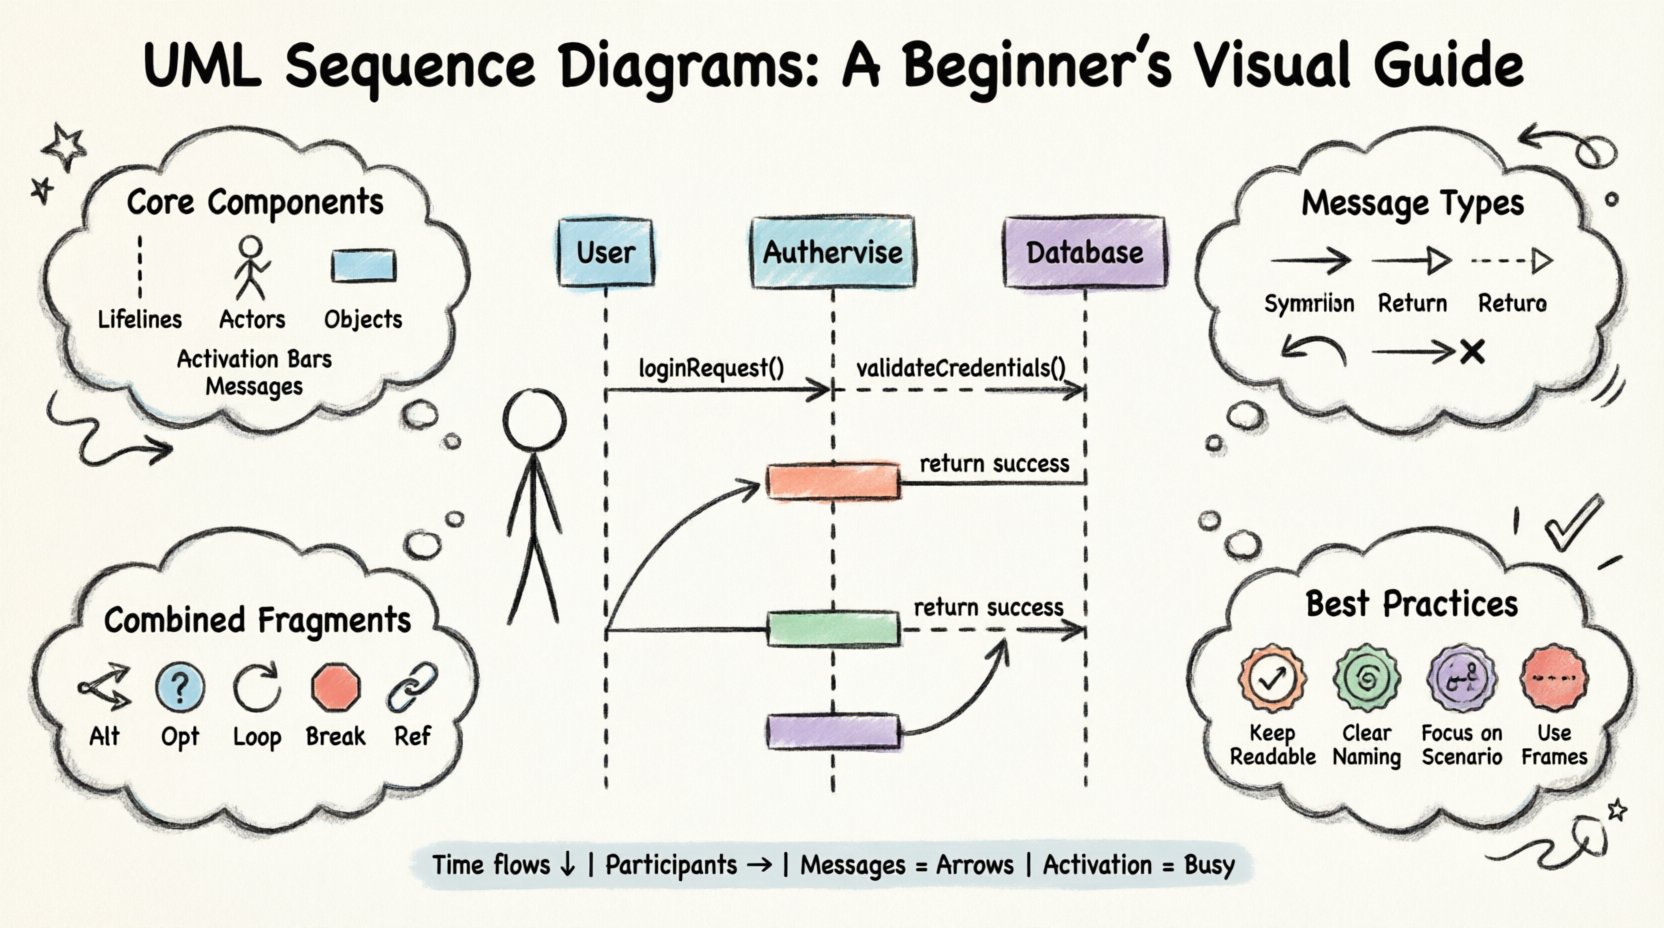
🛠️ Core Components and Notation
To read or create a sequence diagram effectively, one must understand the standard elements. These components form the vocabulary of the diagram.
1. Lifelines
A lifeline represents a participant in the interaction. This could be a user, a database, a server, or a specific software object. It is depicted as a dashed vertical line extending downwards from the participant’s box.
- Participant Box: Placed at the top, containing the name of the object or actor.
- Dashed Line: Extends from the box to the bottom of the diagram, indicating the existence of the participant over time.
2. Actors
Actors represent human users or external systems that initiate interactions. They are typically drawn as stick figures. Actors sit at the far left or right of the diagram to indicate they are external to the system being modeled.
3. Objects
Objects are instances of classes within the system. They are represented by a rectangle with the object name underlined. If multiple instances of the same class are involved, they are named distinctly (e.g., userSession1, userSession2).
4. Activation Bars
An activation bar (or focus of control) is a thin rectangle placed on a lifeline. It indicates the period during which the object is performing an action or waiting for a response. This helps visualize when an object is busy processing versus when it is idle.
5. Messages
Messages represent communication between participants. They are drawn as horizontal arrows pointing from the source lifeline to the target lifeline. The label on the arrow describes the method call, event, or data being passed.
🔗 Types of Messages and Arrows
The direction and style of the arrow convey specific meanings about the interaction type. Understanding these nuances is vital for accurate modeling.
| Arrow Type | Visual Style | Meaning |
|---|---|---|
| Synchronous Call | Filled Arrowhead | The sender waits for the receiver to complete the operation before continuing. |
| Asynchronous Call | Open Arrowhead | The sender sends the message and continues immediately without waiting. |
| Return Message | Dashed Line + Open Arrowhead | The receiver sends a response back to the sender. |
| Self-Reference | Curved Arrow | An object calls a method on itself. |
| Destroy | X Shape | Indicates the end of the object’s lifecycle. |
For instance, in a login process, a user sends a synchronous request to the authentication server. The server processes the credentials and sends a return message. If the process fails, an error message is sent instead.
⚙️ Advanced Constructs: Combined Fragments
Real-world logic often involves conditions, loops, or optional steps. Standard messages cannot represent this complexity alone. UML provides combined fragments to group messages and define their interaction logic.
1. Alt (Alternative)
Used to represent branching logic. Only one of several possible sequences will execute. This is common in if-else scenarios.
- Drawn as a frame labeled alt.
- Contains operands separated by dashed lines.
- Each operand represents a condition (e.g.,
[user is logged in]).
2. Opt (Option)
Similar to alt, but used when a sequence is optional. It represents a if statement without an else block.
- Labelled opt.
- Indicates that the enclosed messages may or may not occur.
3. Loop
Used to represent repeated execution. This maps to for or while loops in programming.
- Labelled loop.
- Can include a condition describing how many times the loop runs.
4. Break
Indicates a section of the interaction that is skipped if a specific condition is met. This is useful for modeling error handling or early exits.
- Labelled break.
- Operands define the condition under which the block is bypassed.
5. Ref (Reference)
Used to simplify diagrams by referencing a sequence diagram defined elsewhere. This avoids cluttering a high-level diagram with detailed sub-processes.
- Labelled ref.
- Points to another diagram or a deeper level of detail.
| Fragment Type | Condition | Use Case |
|---|---|---|
| Alt | Exclusive Branching | User is valid OR invalid |
| Opt | Optional Step | Send email only if configured |
| Loop | Repetition | Process each item in a list |
| Break | Early Exit | Stop processing on timeout |
| Ref | Abstraction | Link to detailed sub-process |
⏱️ Timing and Resource Constraints
Beyond logical flow, sequence diagrams can model temporal constraints. This is crucial for systems where performance and timing are critical.
- Time Constraints: A message can be labeled with a time duration (e.g.,
[timeout: 5s]). This indicates the maximum time allowed for a response. - Resource Usage: Activation bars can be annotated to show resource consumption, such as memory allocation or database locks.
- Signal Events: These are asynchronous events that trigger behavior without an explicit request. They are often used for error notifications or state changes.
✅ Best Practices for Designing Diagrams
Creating a clear diagram requires adherence to certain standards. Poorly designed diagrams can lead to confusion and misinterpretation.
1. Keep it Readable
- Avoid crossing lines where possible. Crossing lines make the flow difficult to follow.
- Use consistent spacing between participants.
- Group related messages together logically.
2. Naming Conventions
- Name objects clearly (e.g., orderService instead of obj1).
- Label messages with method names or clear descriptions.
- Use abbreviations only if they are universally understood within the team.
3. Focus on the Scenario
- Do not attempt to model every single interaction in a system on one diagram.
- Create separate diagrams for different use cases (e.g., Login, Purchase, Logout).
- Keep the scope of the diagram manageable.
4. Use Frames Effectively
- Use alt frames to separate distinct logical paths.
- Use loop frames for batch processing.
- Avoid nesting too many frames, as this creates visual complexity.
🚫 Common Mistakes to Avoid
Even experienced engineers make errors when modeling. Being aware of these pitfalls helps maintain diagram quality.
- Overcomplicating: Trying to show every possible edge case in one diagram makes it unreadable. Break complex logic into smaller diagrams.
- Ignoring Return Messages: Forgetting to show the return path can hide latency issues or error handling paths.
- Mixing Levels of Abstraction: Do not mix high-level business logic with low-level database queries on the same diagram.
- Unclear Actors: Ensure the distinction between the user and the system is clear. Actors should not be inside the system boundary.
- Missing Activation Bars: Without activation bars, it is difficult to see how long an object is blocked or busy.
🔄 Integration into the Workflow
Sequence diagrams are not just documentation artifacts; they are active tools in the development lifecycle.
1. Design Phase
During the design phase, diagrams help teams agree on the interface between components. They serve as a contract that developers can follow.
2. Code Review
Reviewers can compare the code implementation against the sequence diagram to ensure the logic matches the design.
3. Testing
Testers can use the diagram to understand the expected flow of data. This helps in creating integration tests that validate the interaction sequence.
4. Maintenance
When modifying existing systems, diagrams help new team members understand how components interact without reading the entire codebase.
📝 Summary of Key Takeaways
Mastering the creation and interpretation of sequence diagrams requires practice and attention to detail. Here are the core principles to remember:
- Vertical Axis: Represents time. Events flow from top to bottom.
- Horizontal Axis: Represents participants. Layout is static.
- Messages: Define the interaction. Arrows show direction.
- Activation: Shows when an object is busy.
- Combined Fragments: Handle logic like loops and conditions.
By following standard notation and maintaining clarity, teams can leverage sequence diagrams to build more reliable and maintainable systems. These diagrams bridge the gap between abstract requirements and concrete implementation.
🚀 Moving Forward
As you begin creating your own diagrams, start with simple interactions. Add complexity gradually. Use the combined fragments only when necessary to keep the diagram clean. Remember that the goal is communication, not just documentation.
Regularly review and update your diagrams as the system evolves. A static diagram becomes a liability if it does not reflect the current state of the software. By integrating these visual models into your daily workflow, you ensure that the architecture remains clear and the team stays aligned on the system’s behavior.
With patience and practice, you will find that sequence diagrams become an indispensable part of your technical toolkit. They provide the structure needed to navigate complex interactions with confidence.