
Unified Modeling Language, commonly known as UML, serves as a standardized notation for specifying, visualizing, constructing, and documenting the artifacts of software systems. For those entering the field of software engineering or system design, the decision to model ideas manually or through digital means is significant. This choice impacts not only the initial creation phase but also the long-term maintainability and clarity of the system architecture.
Designing a system is akin to drafting a blueprint for a building. Just as an architect chooses between sketching on a napkin and using CAD software, a developer must decide between whiteboarding and using modeling software. There is no single correct path, but understanding the nuances of each approach allows for better decision-making. This guide explores the practical implications of UML tools versus manual drawing, focusing on workflow, collaboration, and precision without relying on hype or marketing claims.
Understanding the Foundation: What is UML Really? 🧩
Before comparing methods of creation, it is essential to understand what is being created. UML is a graphical language, not a programming language. It provides a set of diagrams to represent different aspects of a system. Beginners often confuse the diagram type with the methodology. The goal is communication, not just documentation.
There are two primary categories of UML diagrams:
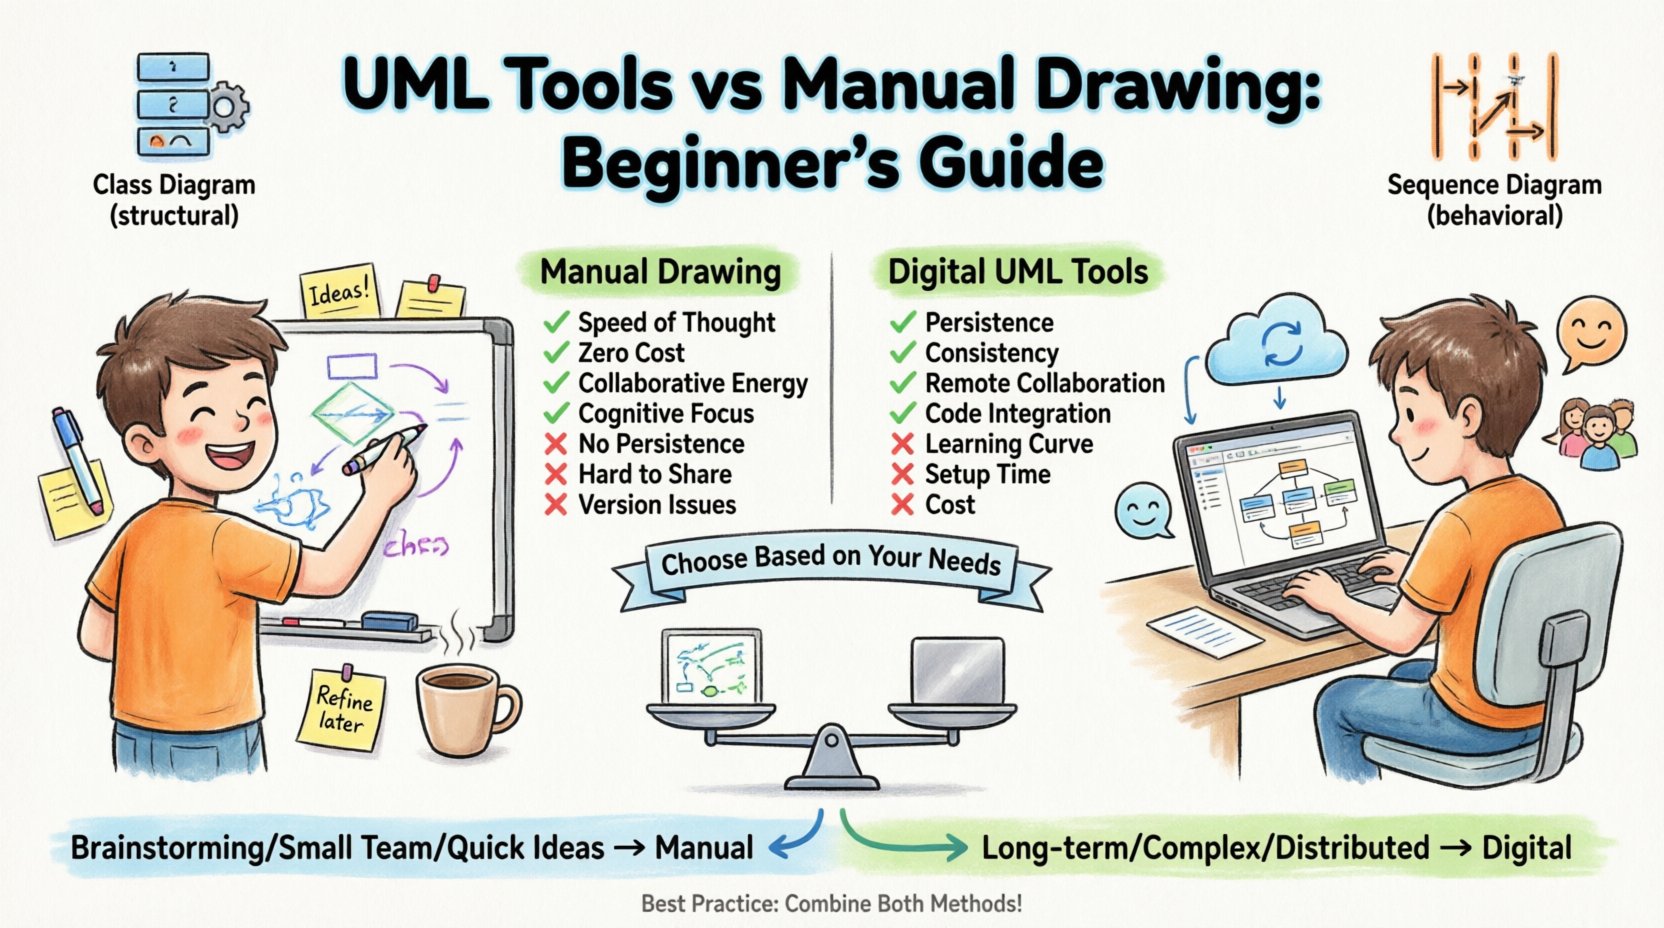
- Structural Diagrams: These show the static structure of the system. Examples include Class Diagrams, Object Diagrams, Component Diagrams, and Deployment Diagrams.
- Behavioral Diagrams: These describe the dynamic behavior of the system. Examples include Use Case Diagrams, Activity Diagrams, Sequence Diagrams, and State Machine Diagrams.
Each diagram type serves a specific audience. A Sequence Diagram explains how objects interact over time, while a Class Diagram defines the data structures. When choosing a medium for creation, the complexity of the diagram often dictates the suitability of the tool or the manual method.
The Case for Manual Drawing ✍️
Manual drawing involves using physical materials such as paper, whiteboards, and markers. This method has been the backbone of software design for decades, even before the standardization of UML. It offers a low-friction environment for ideation.
Key Advantages of Hand Drawing
- Speed of Thought: There is no setup time. You do not need to install software, configure preferences, or learn a user interface. You can capture an idea the moment it occurs.
- Cognitive Focus: Drawing by hand forces you to simplify. You cannot easily create complex nested structures without effort, which naturally encourages high-level thinking rather than getting bogged down in implementation details.
- Collaborative Energy: A whiteboard in a conference room creates a focal point. Team members can stand around, point at elements, and discuss changes in real-time. The physical act of drawing together can foster a shared sense of ownership.
- Zero Cost: The financial barrier is non-existent. All that is required is a writing instrument and a surface.
- Tactile Feedback: Some designers find that the physical act of drawing helps with memory retention and conceptual understanding.
Limitations to Consider
- Lack of Persistence: Whiteboard sketches are ephemeral. Unless photographed, the work is lost when the session ends.
- Version Control Issues: If a diagram changes, the old version is usually discarded. Tracking the evolution of a design is nearly impossible with paper.
- Reproduction Difficulty: Sharing a physical drawing requires scanning or photographing it, which reduces resolution and quality.
- Standardization Risks: It is easier to deviate from UML syntax when drawing by hand. This can lead to ambiguity for other team members who are not present during the initial session.
The Case for UML Modeling Software 🛠️
Digital modeling tools provide a structured environment for creating and managing diagrams. These applications range from simple drawing canvases to complex environments with code generation capabilities. The choice of software depends on the project requirements, but the core benefits remain consistent.
Key Advantages of Digital Tools
- Persistence and Storage: Files are saved digitally. They can be backed up, versioned, and retrieved years later without degradation.
- Consistency: Software enforces standards. Connector lines snap to shapes, and symbols are pre-defined. This ensures that a “Use Case” looks the same to everyone reading the document.
- Collaboration Features: Modern platforms allow multiple users to work on a diagram simultaneously, regardless of physical location. Comments and annotations can be attached directly to elements.
- Integration: Many tools allow for reverse engineering (converting code to diagrams) or forward engineering (generating code from diagrams). This reduces the gap between design and implementation.
- Searchability: You can search a diagram for a specific class name or method instantly. This is impossible with a scanned image of a whiteboard.
Limitations to Consider
- Learning Curve: Software requires time to learn. Beginners may spend more time learning the tool than designing the system.
- Setup Time: Creating a complex diagram in software takes longer than sketching a rough draft on paper.
- Cost: Professional tools often require subscriptions or licenses, which adds to project overhead.
- Focus Distraction: Users may get distracted by formatting options, colors, and layout tools rather than the actual logic of the design.
Comparing the Approaches 📊
To make an informed decision, it is helpful to compare specific attributes side-by-side. The following table outlines the practical differences between manual and digital methods across common project dimensions.
| Attribute | Manual Drawing | Digital Tools |
|---|---|---|
| Speed of Initial Creation | Very Fast | Medium to Slow |
| Ease of Modification | Difficult (Redraw needed) | Easy (Drag and drop) |
| Version History | Non-existent | Robust (Git/Cloud) |
| Collaboration Scope | Local (Physical) | Global (Remote) |
| Accuracy & Standards | Variable | High |
| Cost | Low | Variable (Free to High) |
| Searchability | None | Full Text Search |
| Integration with Code | None | Possible |
When to Choose Which Method? 🤔
There is no universal rule. The best approach depends on the context of the project. Here are scenarios where one method typically outperforms the other.
Scenarios Favoring Manual Drawing
- Briefing Sessions: When starting a new project or feature, a quick whiteboard session helps align the team before any formal design begins.
- Brainstorming: During the initial ideation phase, constraints should be low. Paper allows for free-flowing ideas without worrying about perfect alignment.
- One-off Documentation: If a diagram is only needed for a specific meeting and will not be maintained, a photo of a sketch is sufficient.
- Small Teams: For teams working in the same physical location, the friction of digital tools may outweigh the benefits.
Scenarios Favoring Digital Tools
- Long-term Maintenance: If the system is expected to evolve over months or years, digital files ensure the documentation remains current.
- Complex Systems: For large architectures with hundreds of classes, manual drawing becomes unmanageable. Digital tools handle complexity better.
- Distributed Teams: When developers are in different time zones, digital collaboration is the only viable option.
- Regulatory Compliance: In industries like healthcare or finance, documentation standards are strict. Digital tools ensure consistency and auditability.
- Code Generation: If the project uses model-driven development, digital tools are mandatory to bridge the gap between design and code.
The Lifecycle of a Diagram 🔄
Creating a diagram is only the first step. The true value lies in how the diagram is maintained throughout the software development lifecycle. Both manual and digital methods struggle with the “Documentation Rot” problem, where the documentation becomes outdated as the code changes.
Handling Changes
- Manual: When a class changes, the sketch must be redrawn. This is often forgotten. The old sketch remains on the wall or in a folder, leading to confusion.
- Digital: A change in the code can be reflected by updating the model. However, if the model is not updated immediately, the same confusion occurs.
Digital tools mitigate this risk by allowing for version history. You can see exactly what changed between version 1.0 and 1.1. This is crucial for audits or understanding why a design decision was made six months ago.
Accessibility
- Manual: Only those in the room can see the whiteboard. Remote team members are excluded from the design discussion.
- Digital: Files can be shared via links. Anyone with access can view the diagram on their own device, at their own pace.
Best Practices for Effective Modeling 📝
Regardless of the medium chosen, certain principles apply to ensure the modeling effort adds value rather than hindering progress.
- Keep it Simple: Do not model every single method or variable. Focus on the architecture and the critical flows. If a diagram takes more than 15 minutes to create, it may be too complex for the current stage.
- Standardize Notation: If you use digital tools, ensure the team agrees on the notation. If you draw manually, agree on the symbols used for connections and boundaries.
- Focus on the Audience: A diagram for a manager looks different from one for a developer. Tailor the level of detail to the reader.
- Review Regularly: Schedule time to review diagrams during sprint reviews. If a diagram is no longer accurate, update it or delete it. Outdated diagrams are worse than no diagrams.
- Combine Methods: Use manual drawing for the initial concept and digital tools for the finalized documentation. This leverages the speed of paper and the permanence of software.
Common Pitfalls to Avoid 🚫
Beginners often fall into traps that waste time and reduce the quality of the design.
Over-Engineering the Design
Trying to model every possibility before writing code is a common mistake. This is often referred to as “analysis paralysis.” Start with the happy path and expand as requirements become clearer.
Ignoring the Code
A diagram is useless if it does not match the code. If the code changes and the diagram does not, the diagram is technically debt. Ensure that the team prioritizes documentation updates alongside code changes.
Poor Labeling
Labels on connectors and shapes are critical. “Object A” is not helpful. “User Object” or “PaymentProcessor” provides context. Ambiguity in labels leads to bugs in implementation.
Tool Fetishism
Choosing a tool because it has the most features is a mistake. Choose the tool that the team can use effectively. A simple, free tool used consistently is better than an expensive, complex tool that nobody uses.
Future Trends in Modeling 🚀
The landscape of system design is evolving. Artificial Intelligence is beginning to assist in diagram generation. Some tools now suggest UML structures based on code analysis. Cloud-based collaboration is becoming the standard, reducing the need for local file management.
However, the fundamental human need for visualization remains. Whether through a marker or a mouse, the goal is to externalize thought. As technology advances, the line between manual and digital may blur, with AI handling the formatting while humans focus on the logic.
Final Considerations 🏁
Selecting between UML tools and manual drawing is not a binary choice. It is a spectrum of activity within a project lifecycle. The most effective teams often utilize both. They use whiteboards for the chaotic, creative phase and software for the structured, permanent phase.
For beginners, the advice is to start with the medium that removes the most friction. If you are brainstorming, use paper. If you are documenting for a team, use software. The value of UML lies in the clarity it brings to complex systems, not in the perfection of the drawing itself. By focusing on communication rather than aesthetics, you ensure that your design efforts translate into working software.
Remember that the best model is the one that is actually read and used. If a complex digital diagram sits in a repository and is never opened, it provides no value. If a simple sketch on a napkin guides the development of a critical feature, it is a success. Evaluate your methods based on outcomes, not tools.